

Introduction
Reports & Dashboards for VTiger is a tool built to fulfill the needs of all businesses looking to run complicated, but easy-to-read reports. It includes a report builder which is capable of Detailed, Summary, Pivot, Chart/Graph reports. All the charts and reports can be placed on the dashboard for quick & easy access.
The extension includes a lot of unique features such as drag & drop interface, a completely redesigned interface for creating reports, highlighting columns, up to 3 charts per report, both detail and chart reports added on the homepage dashboard, custom permissions, scheduled reports & much more.
Reports & Dashboards
Vreports & Dashboard extension consists of two major components i.e. Vreports and Dashboards
Vreports
In Order to access Reports & Dashboard follow these simple steps.
Click the Menu Icon present on the top left corner.
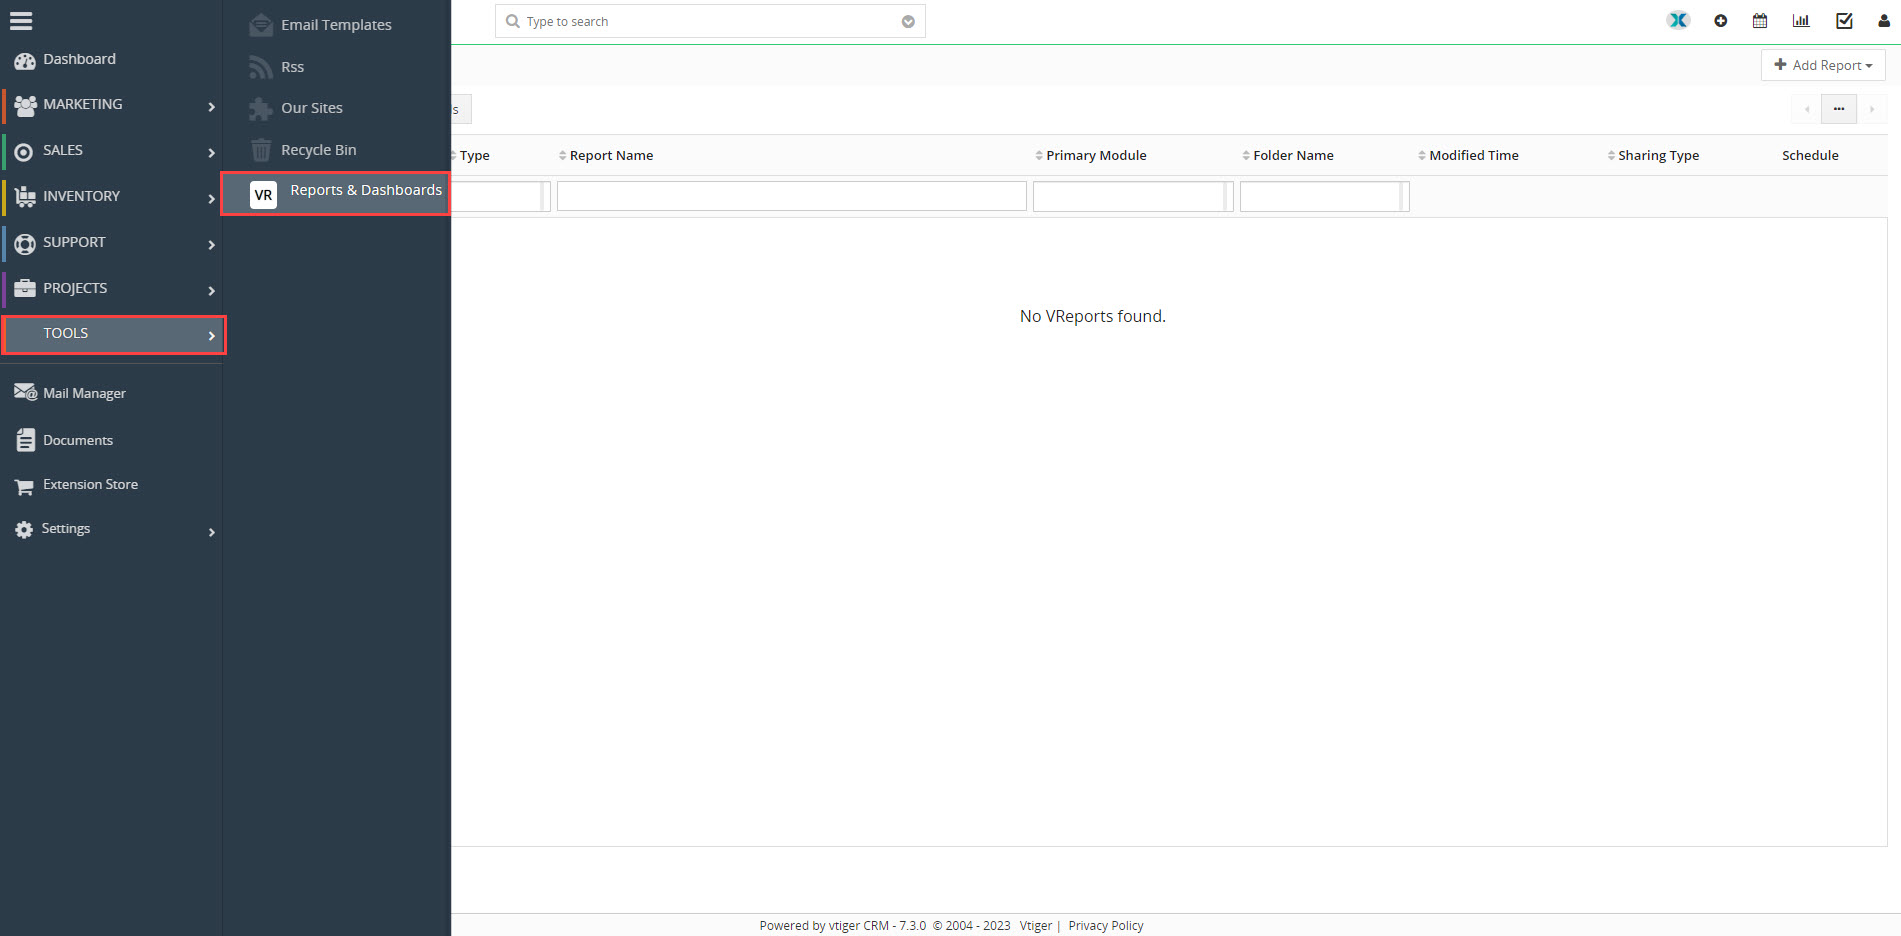 Go to TOOLS ➤ and then VReports & Dashboards.
You will be directed toward the List view section of the extension as shown below.
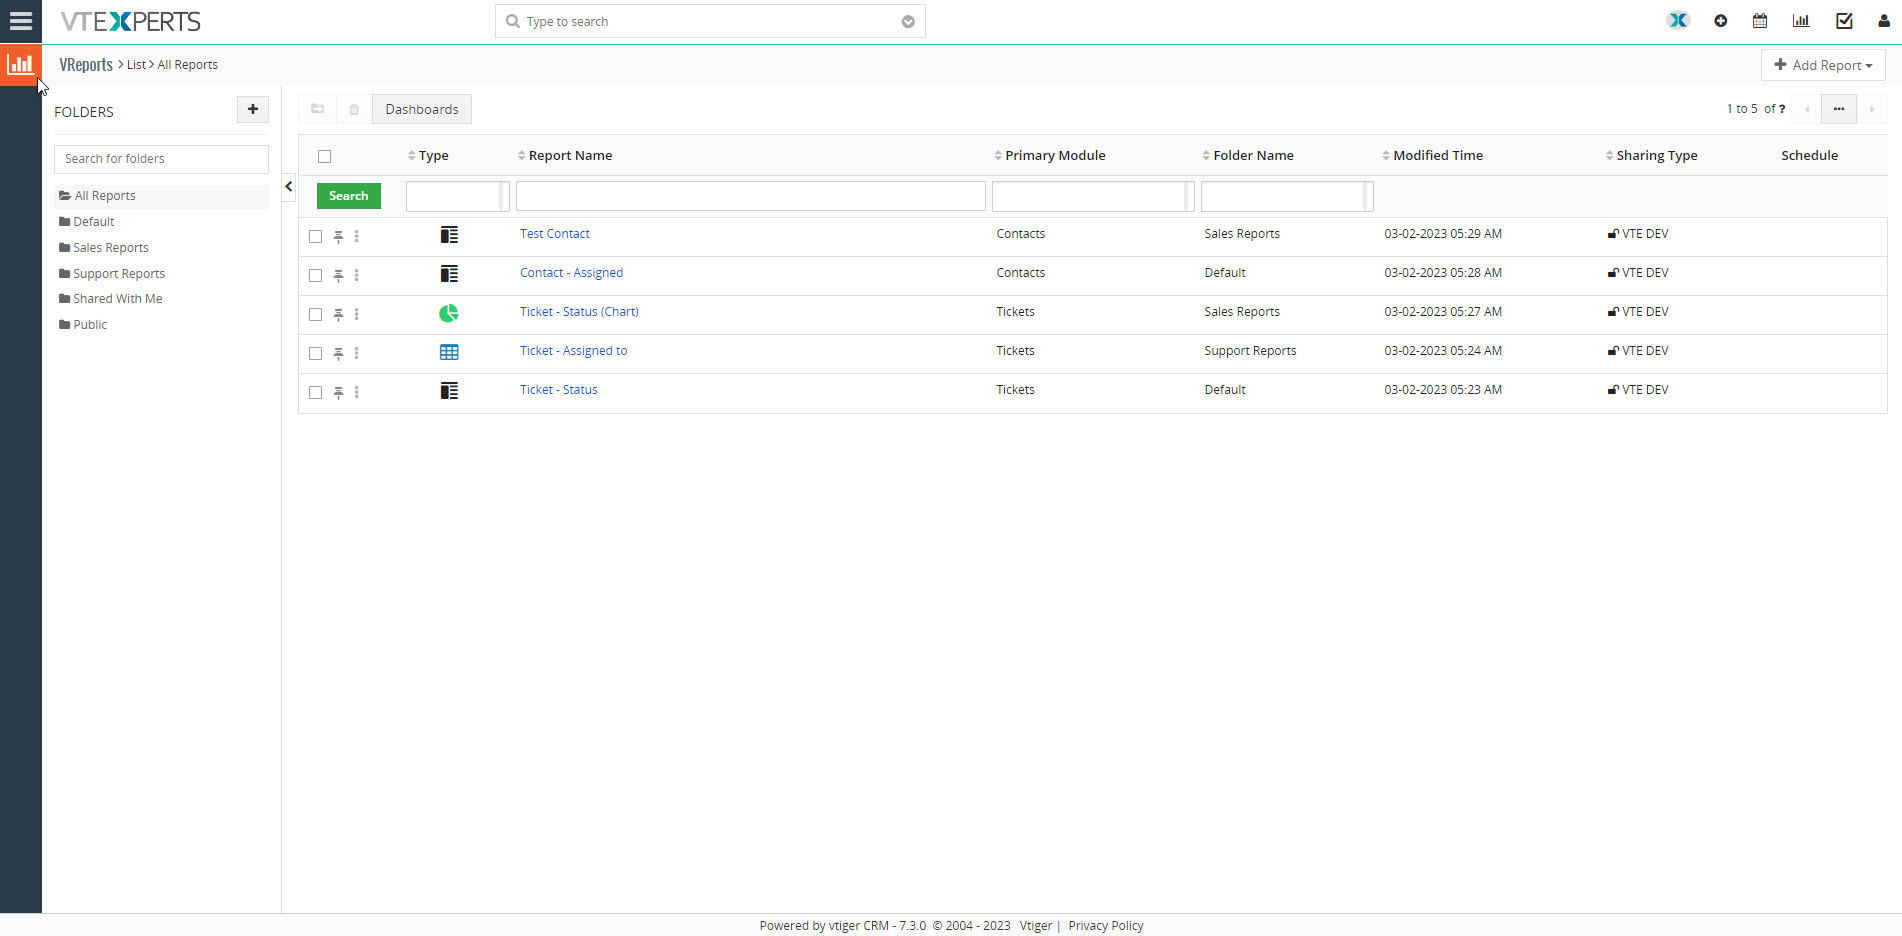 Here you can see all the Reports created and shared with you.
In the left corner, you will see the folders
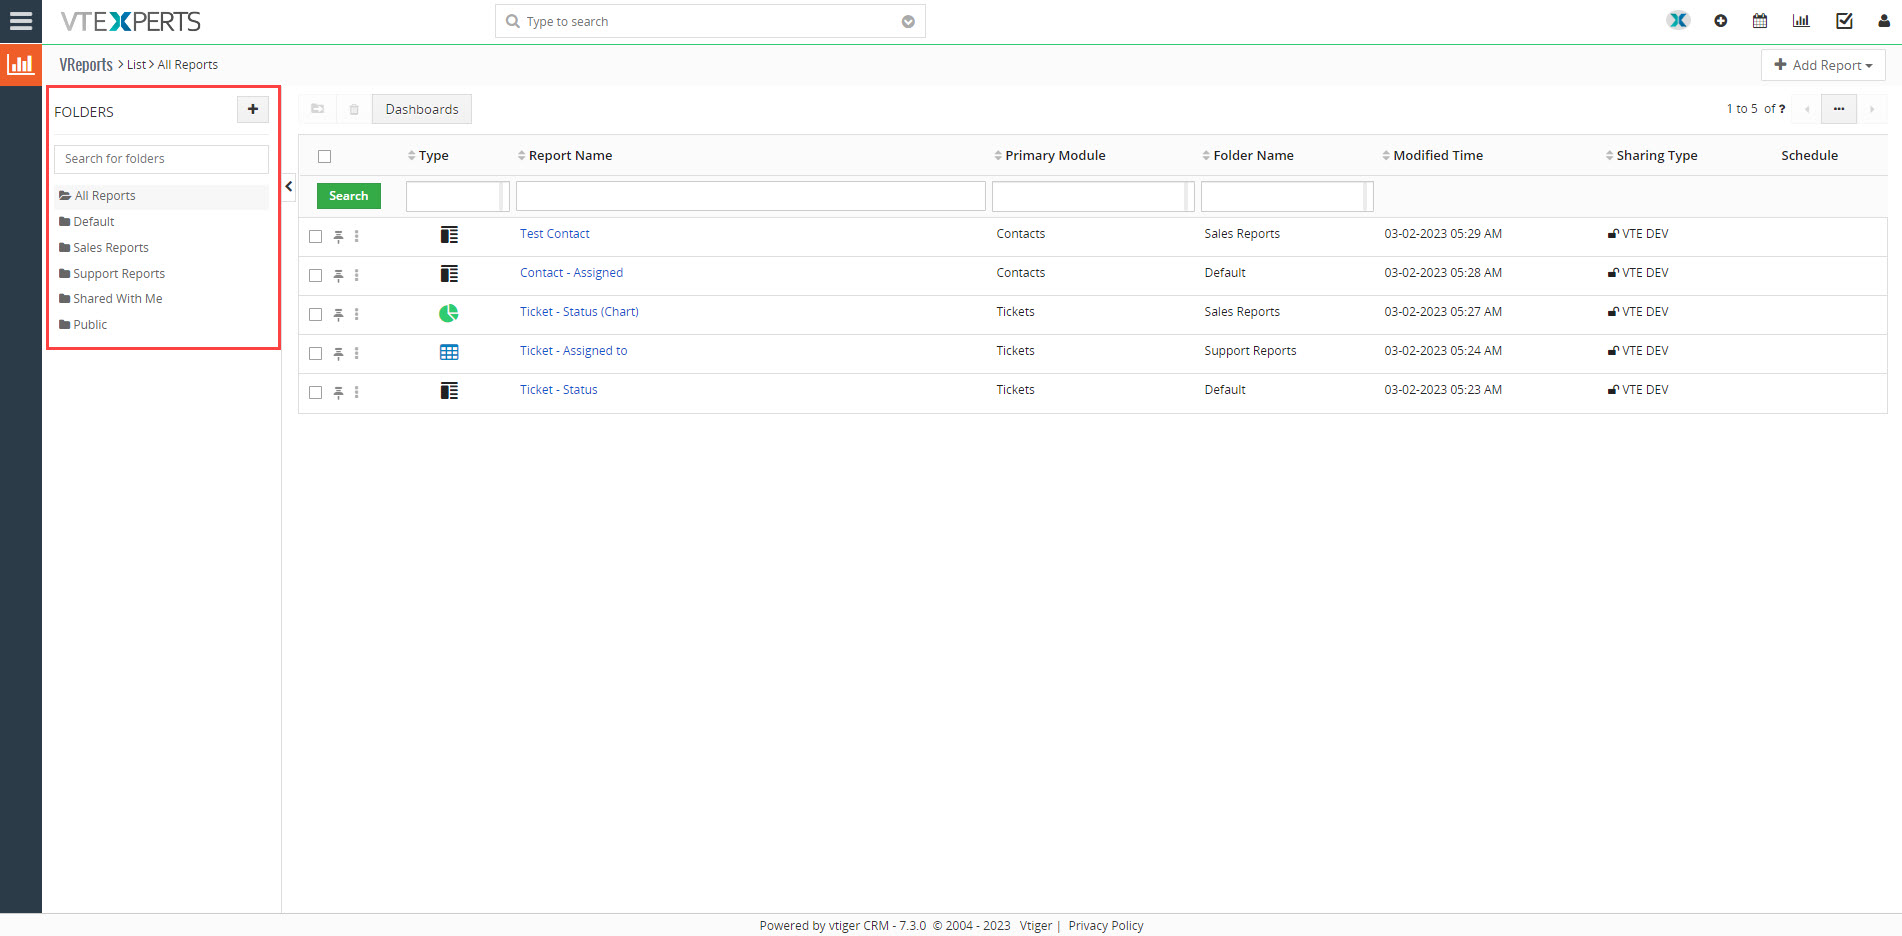 You can classify and organize the reports based on their nature under respective folders which will then be easier to find. During the creation of a Report, you can specify the folder in which you want the report to reside.
Types of Reports
There are 4 types of Reports that you can create, which include
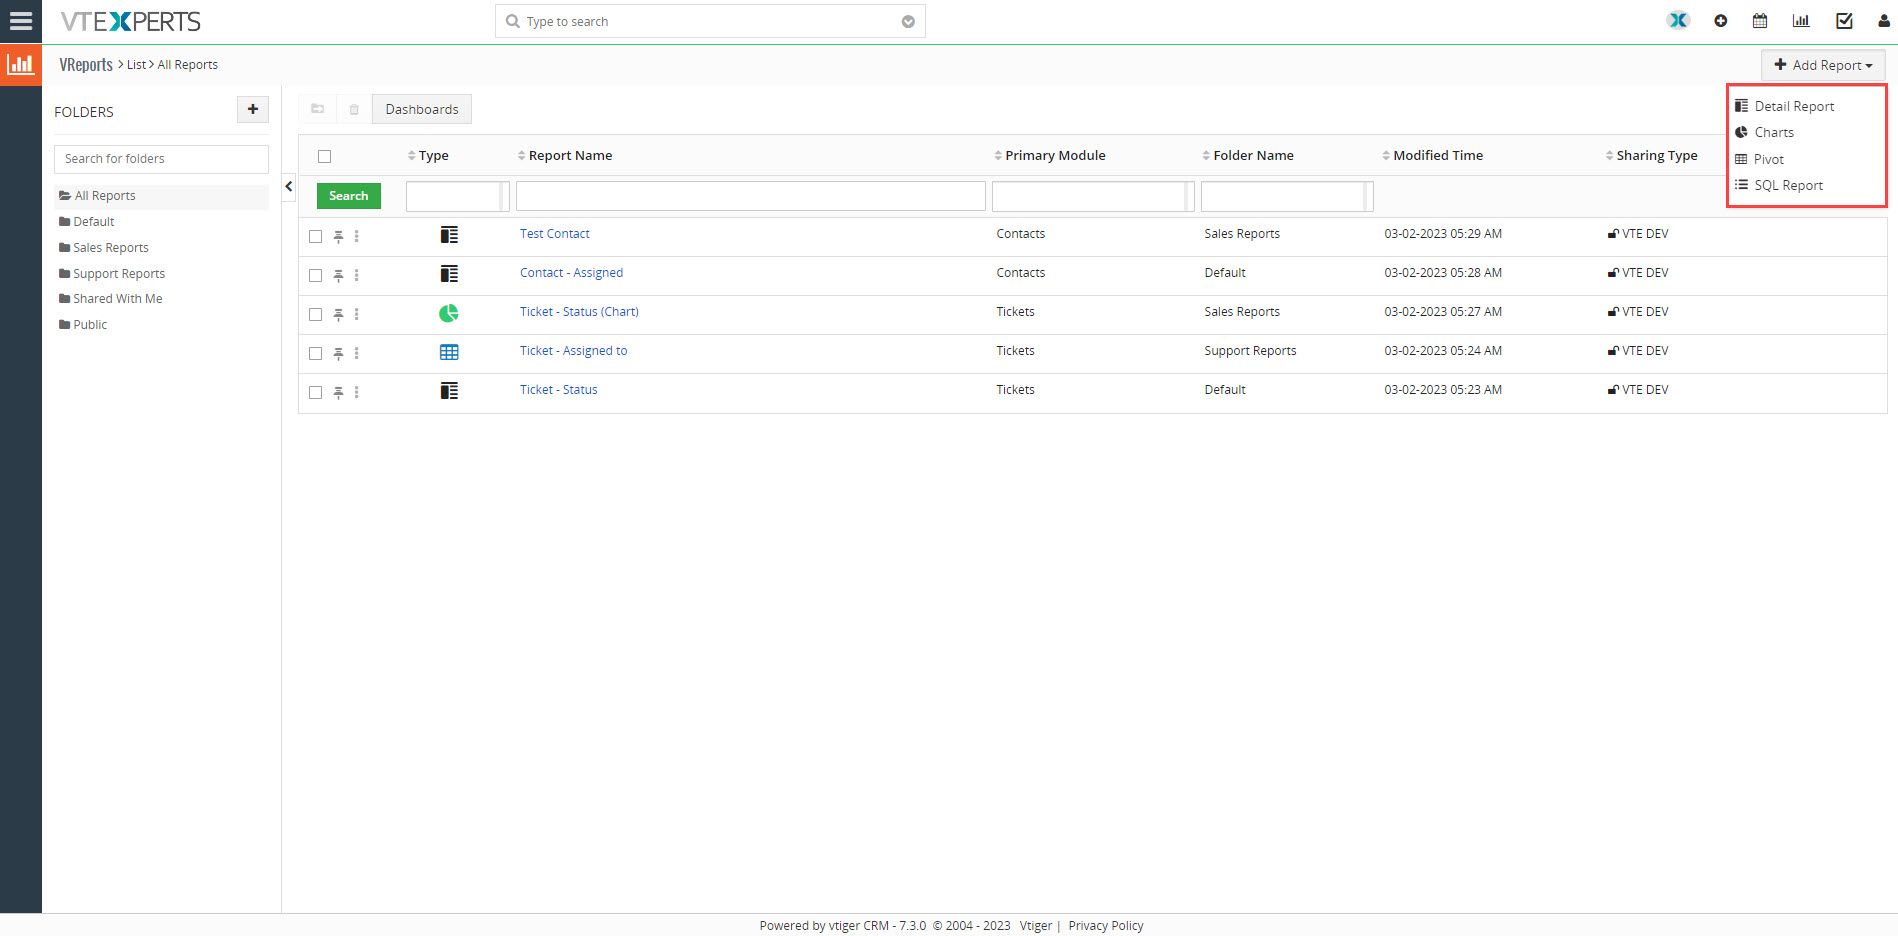
- Detail Report: Details reports provide comprehensive data analysis and are the most common type of report.
- Charts: Chart reports use graphics to display data in form of charts. VTExperts charts reports support 8 different types f charts including pie charts, doughnut charts, vertical car charts, etc
- Pivot reports: In a pivot report, data is organized into rows and columns, and can be sorted, filtered, and grouped to provide insights into trends and patterns
- SQL Report: SQL reports are generated using the Structured Query Language (SQL)
Creating Detail Report
In order to create a Detail Report go to the Add Report button at the top right corner “+Add Report” and select Detail Report.
A Detail Report is created in 3 steps which are as follows.
Step 1: Report Details
This is the first step in creating a Detail Report.
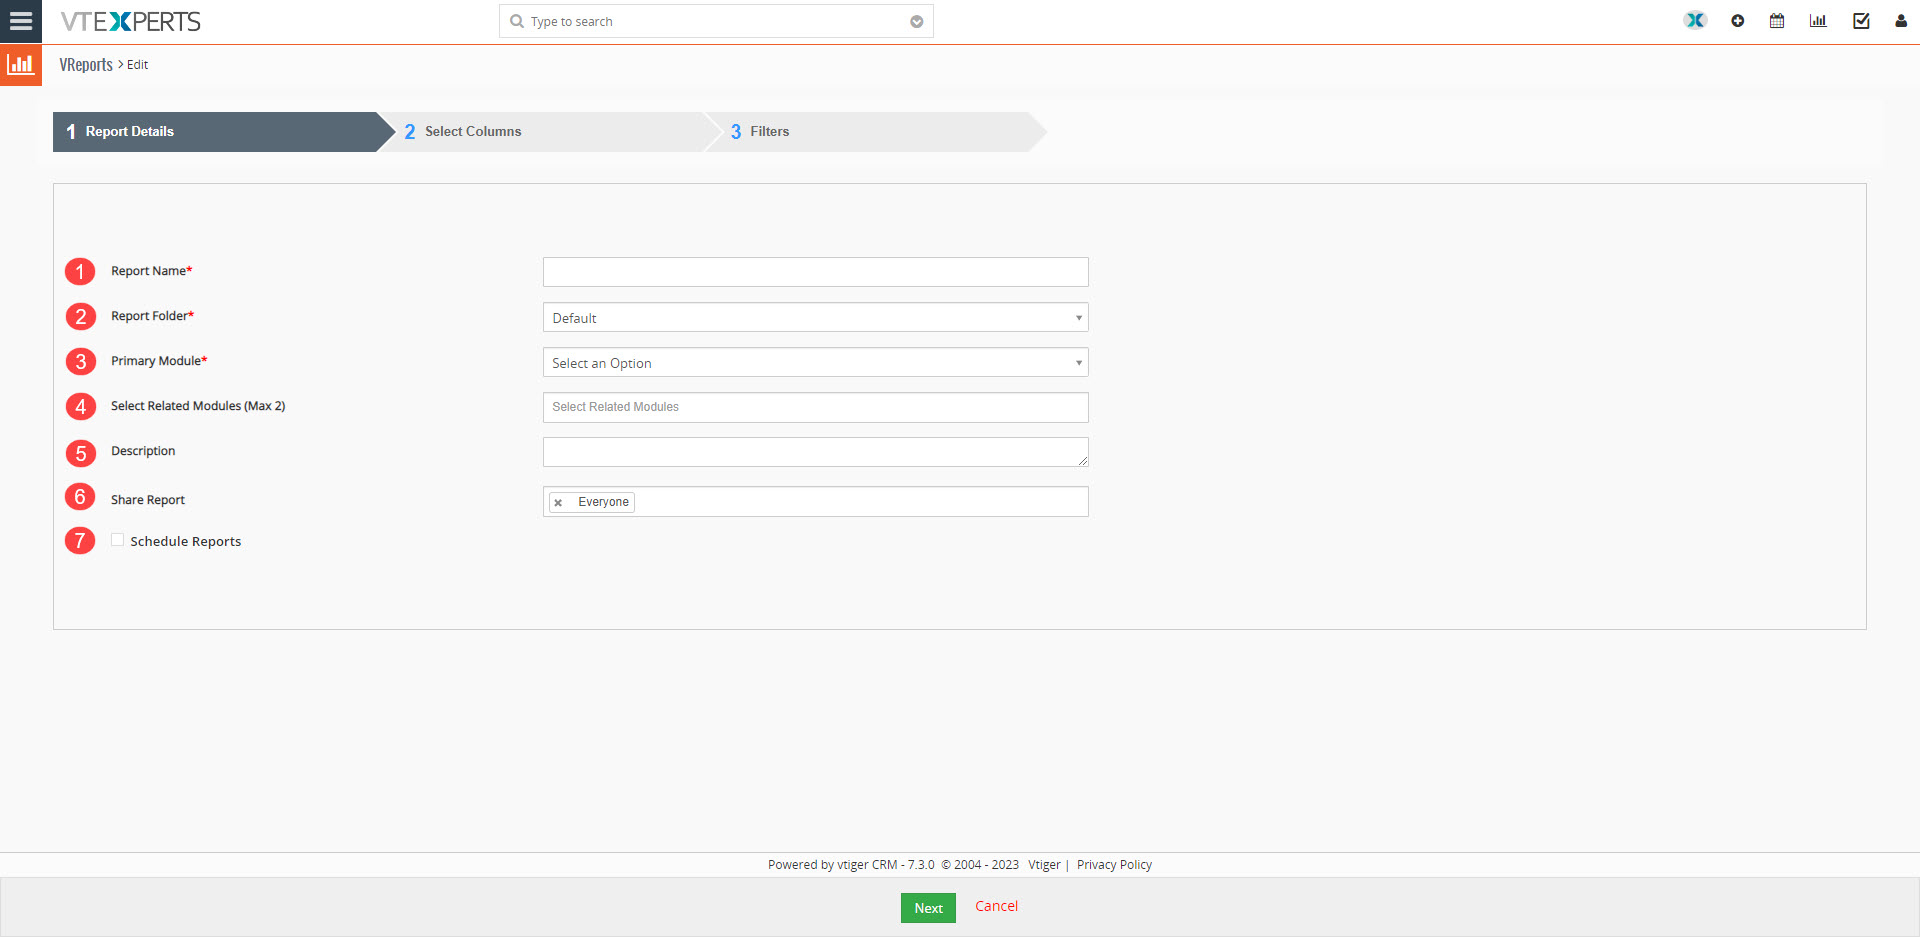
It includes fields like
- Report Name: Type in the name of the report.
- Report Folder: Specify the folder you want the report to be in.
- Primary Module: Select the primary module you want the report to be in.
- Select Related Modules: Select related modules (if any) you can only choose a maximum of 2 related modules
- Description: Add a custom description to the report.
- Share Report: Specify the users who can see the report
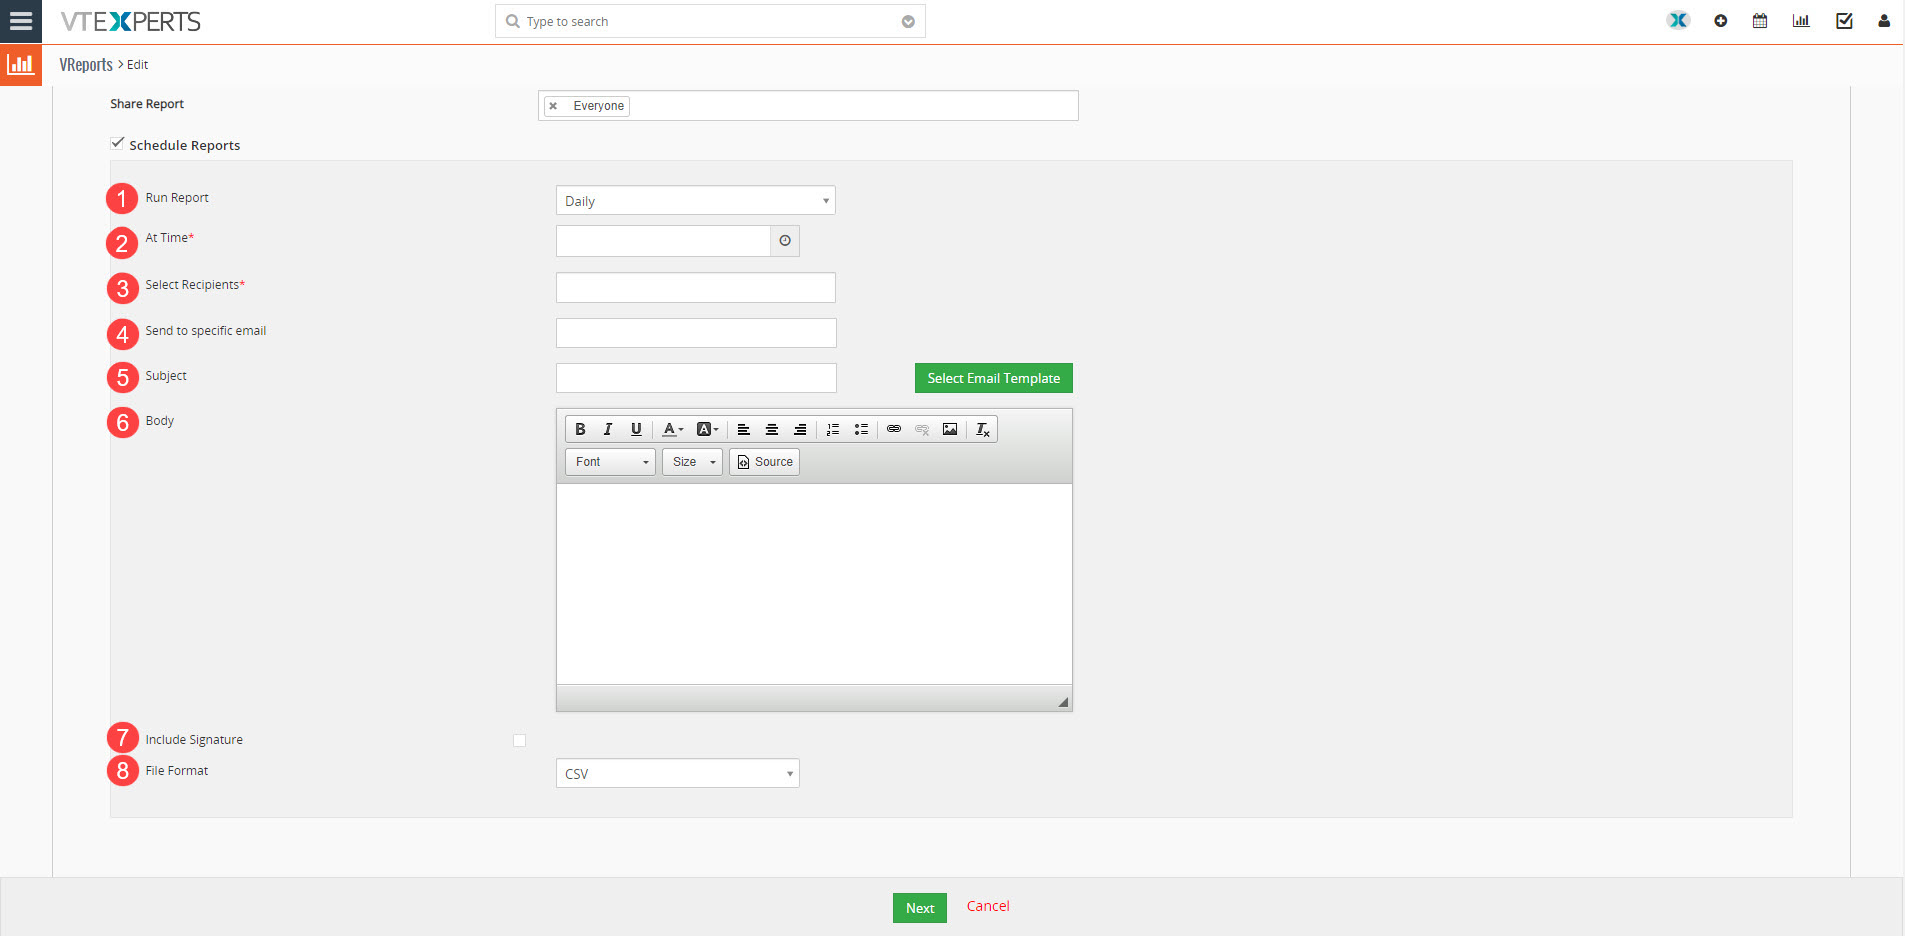
- Schedule Reports: If you want to schedule the report to be sent as emails check the block. Checking “Schedule Reports” will bring additional settings for scheduling.
-
-
-
- Run Report: Where you can set the frequency of the Report, for example Daily, Weekly, Monthly, or on a specific Date
- At Time: Specify the time you want the report to run
- Select Recipients: Specify the recipients
- Send to specific email: If you wish to send the report to a specific email, type in the address
- Subject: Specify the subject of the email.
-
Body: Specify the message of the email body here
You can also select a pre-existing template using “Select Email Template” button, which will automatically fill in the Subject and the body of the email.
You can also select a pre-existing template, which will automatically fill in the Subject and the body of the email.
- Include Signature: Checking the box in front of include signature will allow you to add a signature to the email.
- File Format: Select the format of the file either CSV or Excel.
-
-
-
Click on Next to proceed to the next step.
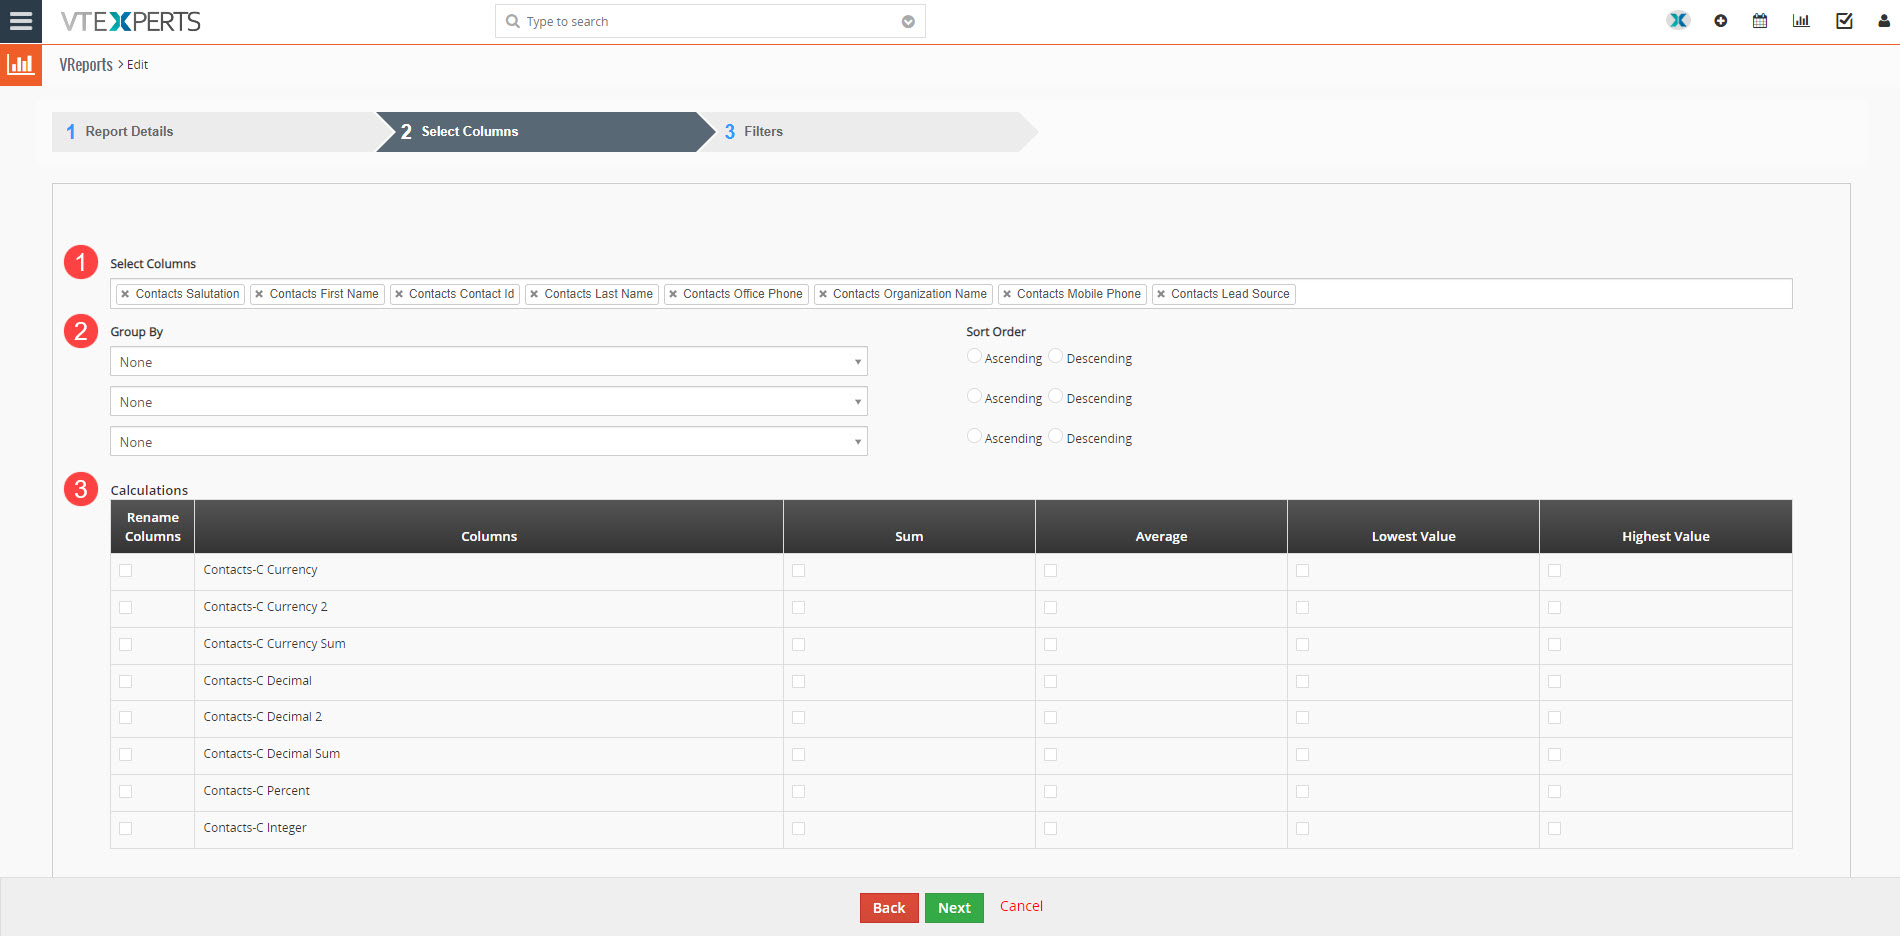
Step 2: Select Columns
The second step in creating a Detail Report is Selecting the Columns.
-
-
-
- Select Columns: This is where you will specify the number of columns you want in the report and the sequence.
- Group By: You can group the records based on selecting the desired field and then sorting them in ascending or descending order.
- Calculations: Calculations help you with applying formulas like Sum, Average, lowest and highest value of the fields (columns) you want.
-
-
Click Next to proceed to third step.
Step 3: Filters
The third step in creating a Detail Report is Filters.
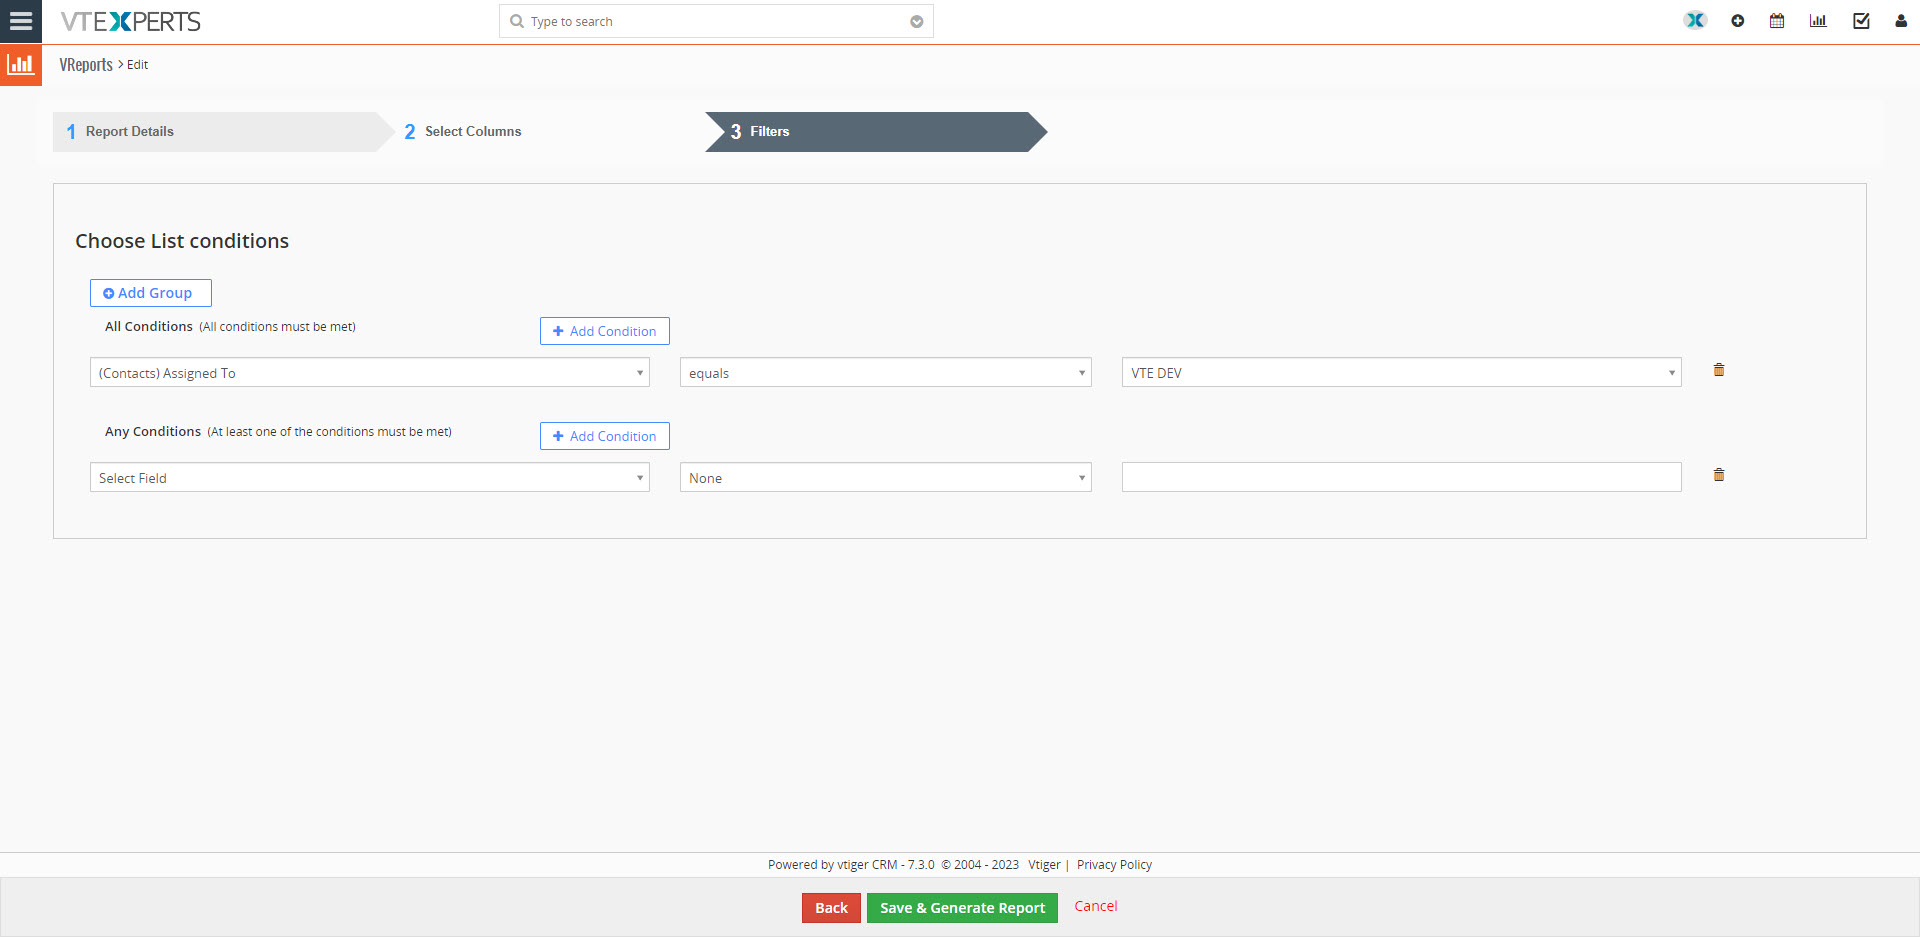 Here you can apply the conditions you want for your Report.
After specifying the conditions click “Save & Generate Report” to create the report. The final report will look like this.
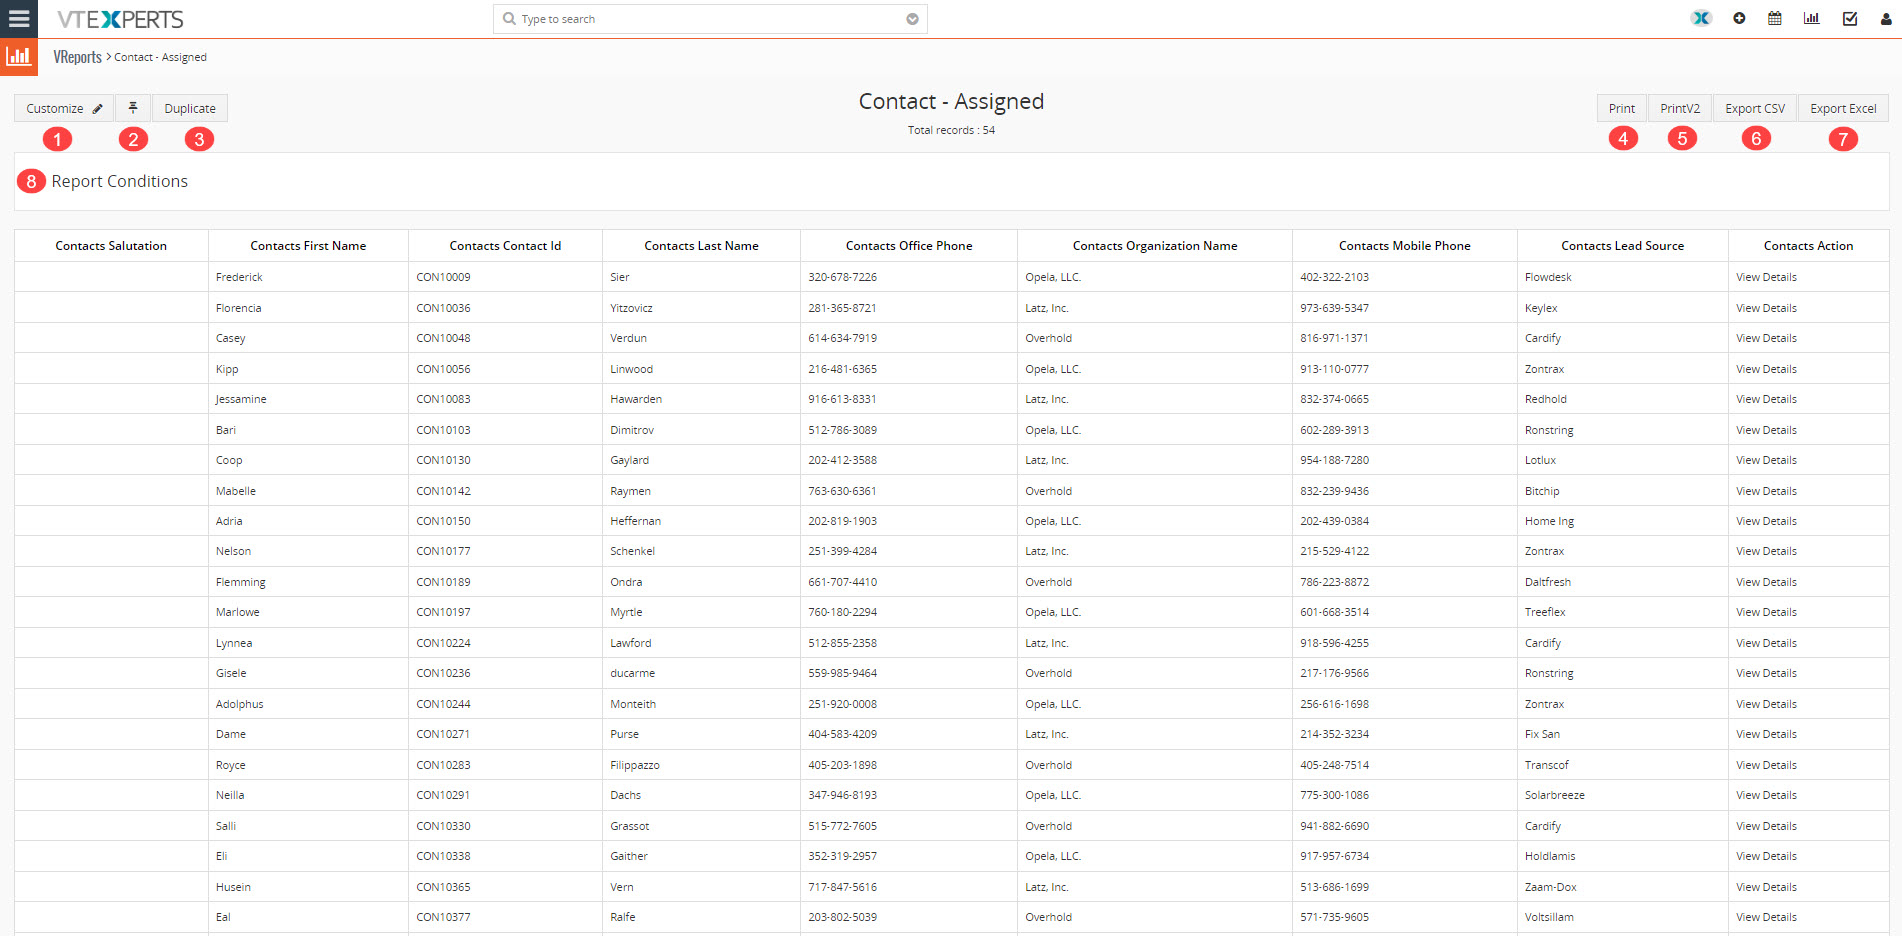
Here you can perform actions like,
-
-
- Customize the report again.
- Pin the report.
- Create a duplicate report
- Print the report
- PrintV2, it shows an alternate print format of the report
- Export CSV
- Export Excel
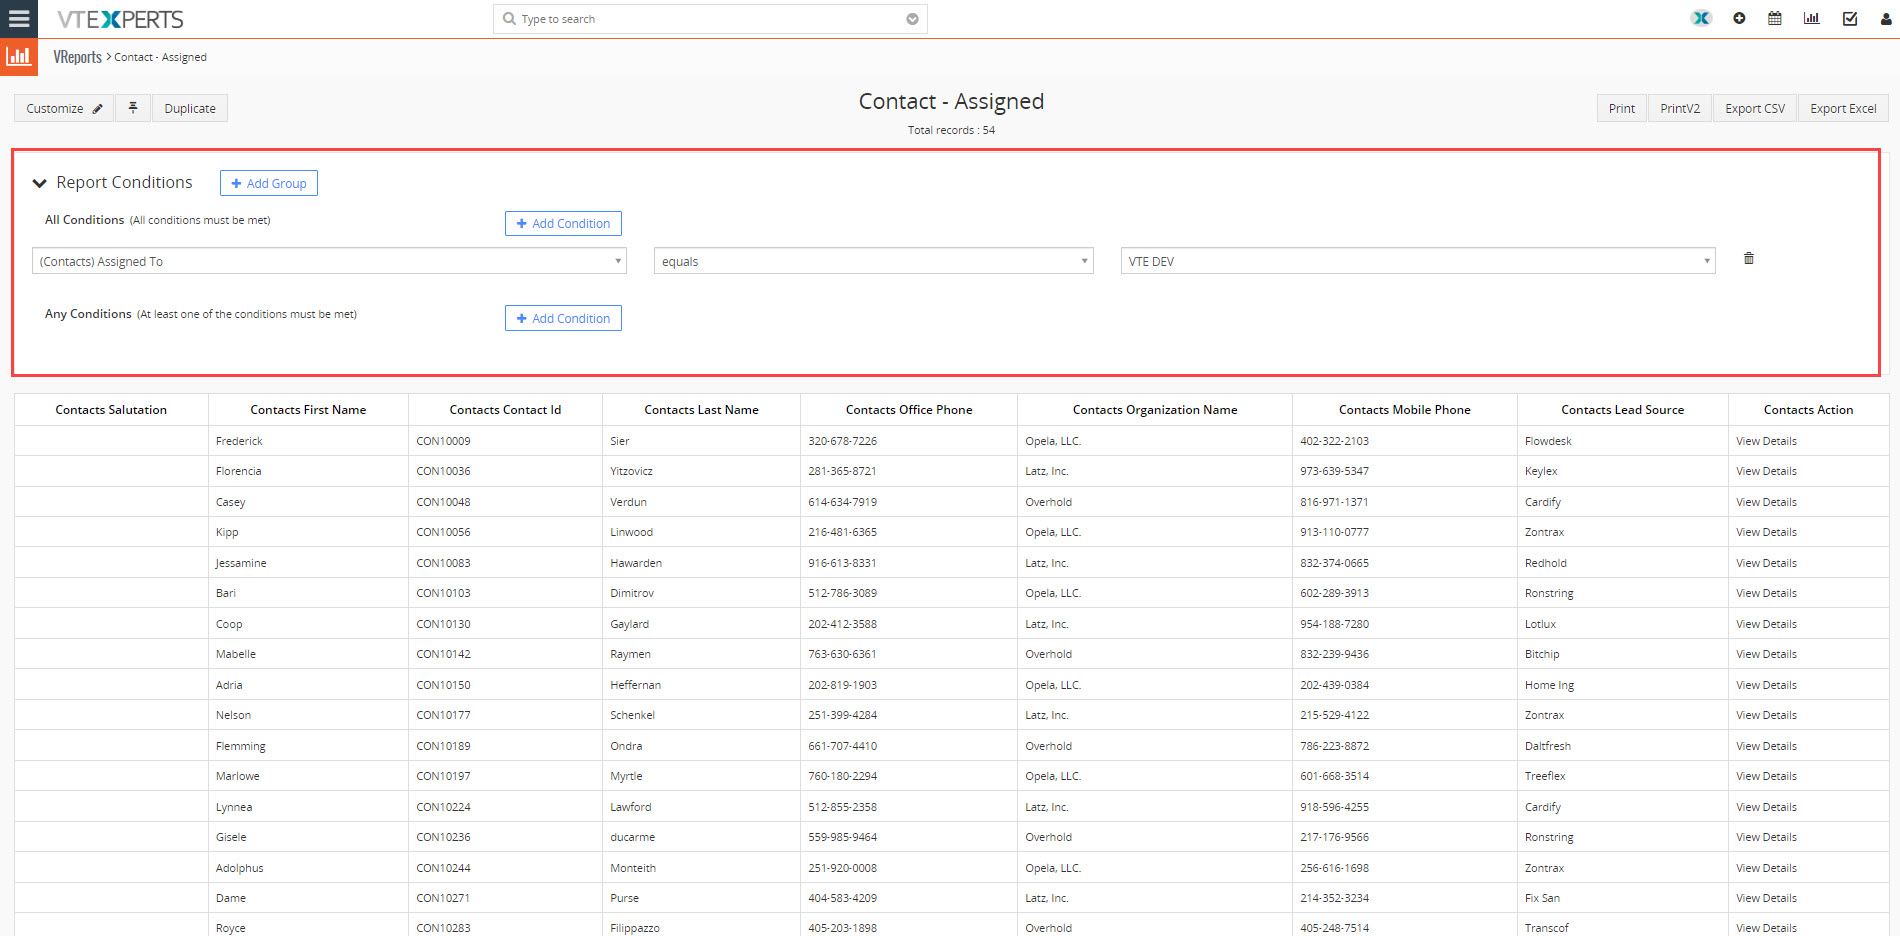
- Change the Report conditions by clicking “Report Conditions”, it will show the conditions already setup for the report and you can change those without editing the whole report again.
-
Once you specify the conditions hit “Save” in order to confirm the changes.
Dashboards
User can access the Vreport’s Dashboard by clicking the Dashboard button
-
-
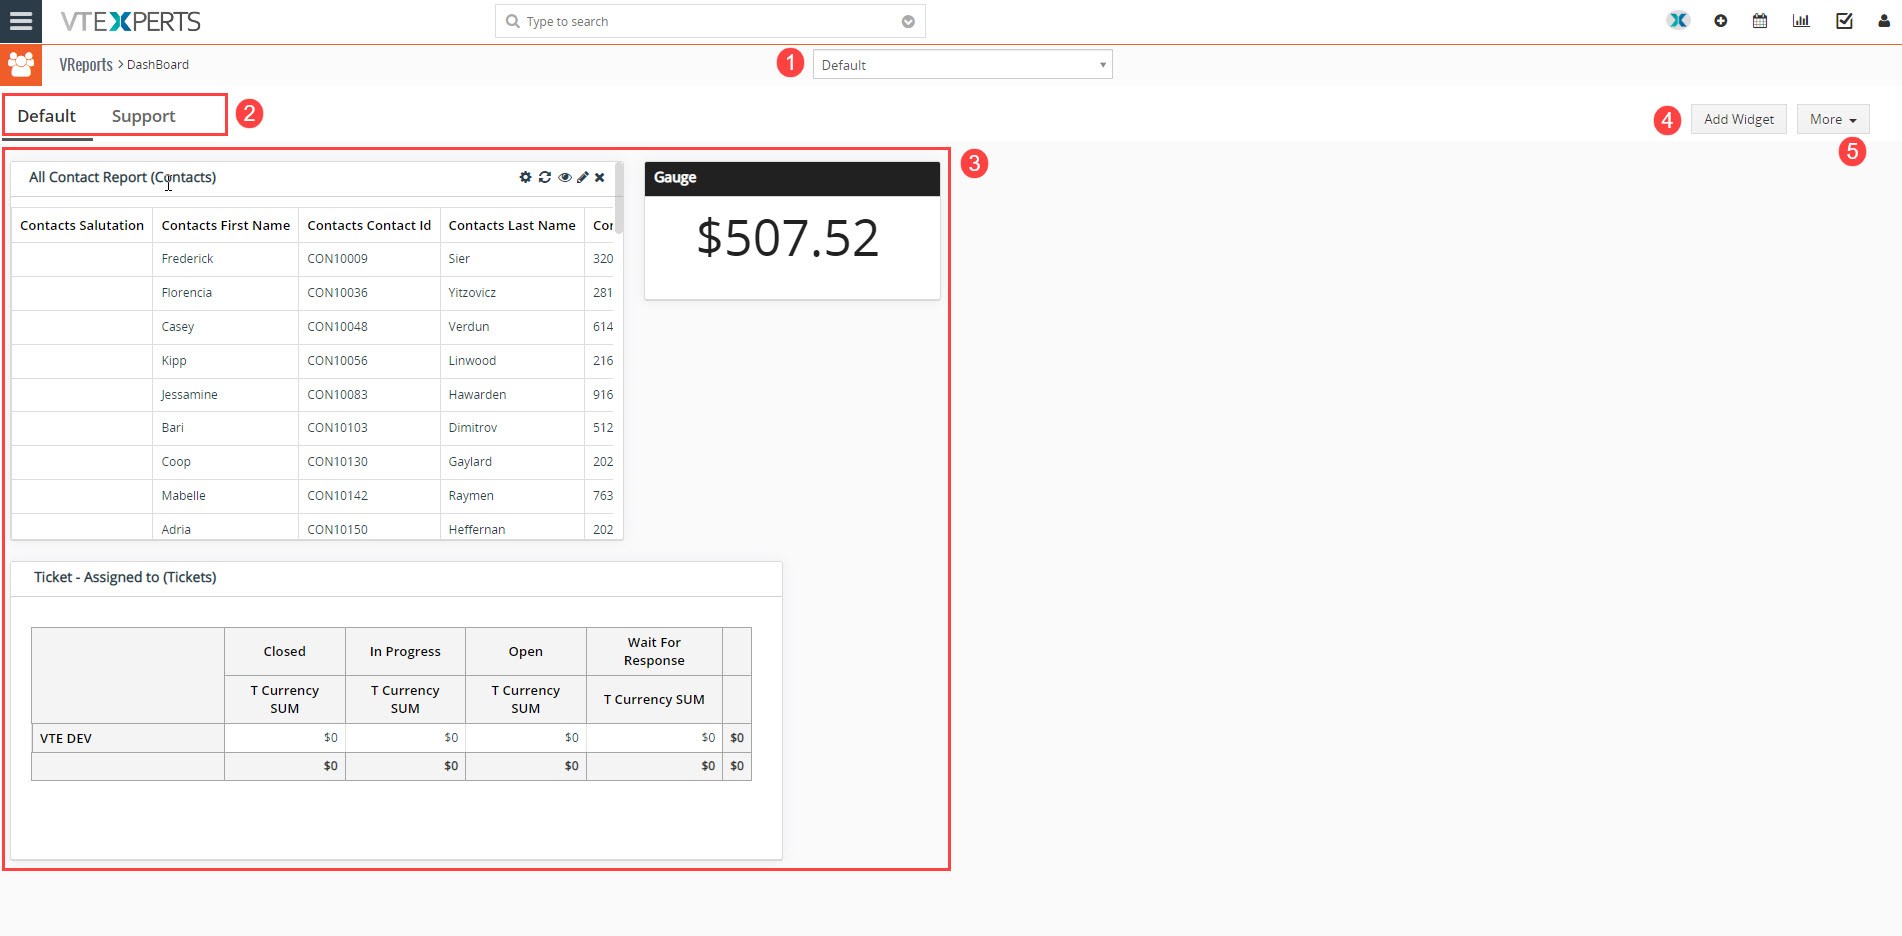 Select the dashboard which you want to edit, as Vreports & Dashboards allows to add multiple dashboards
- A dashboard can have multiple tabs, e.g. Default and Support tab
- Dashboard showing all the widgets added to it
- Using add widget button you can add different widgets to the dashboard
- Click more for to access configuration related to widgets, tabs and dashboards
-
Widgets
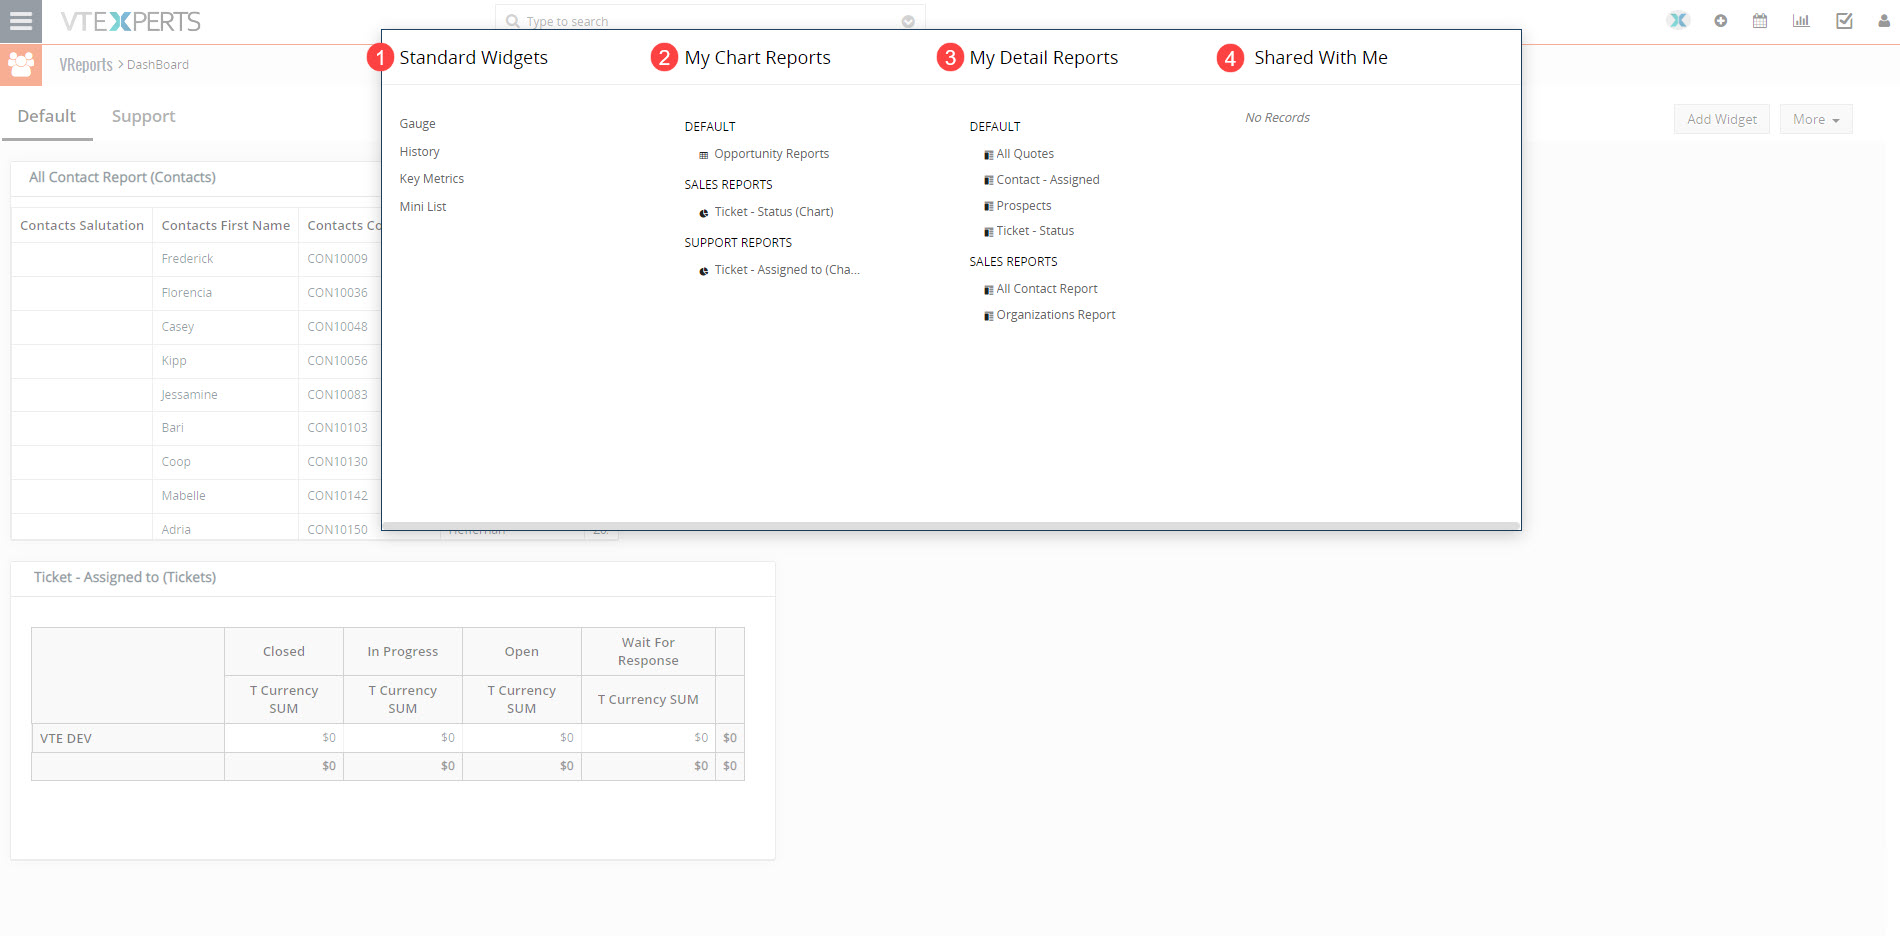
Click “+Add Widget” button to configure widgets for the dashboard. Once clicked, it will show the following screen
-
-
- Standard Widget: There are four types of standard widget that can be added to the dashboard. Details of these widgets will be discussed further in this article
- My Chart Reports: From here user can add the chart reports to the dashboard created by him/herself
- My Detailed Reports: From here user can add the detailed reports to the dashboard created by him/herself
- Shared with me: From here user can add reports to the dashboard which are shared with him/her by other users
-
Standard Widgets
User can add four types of standard widgets to the dashboard, which are as follow
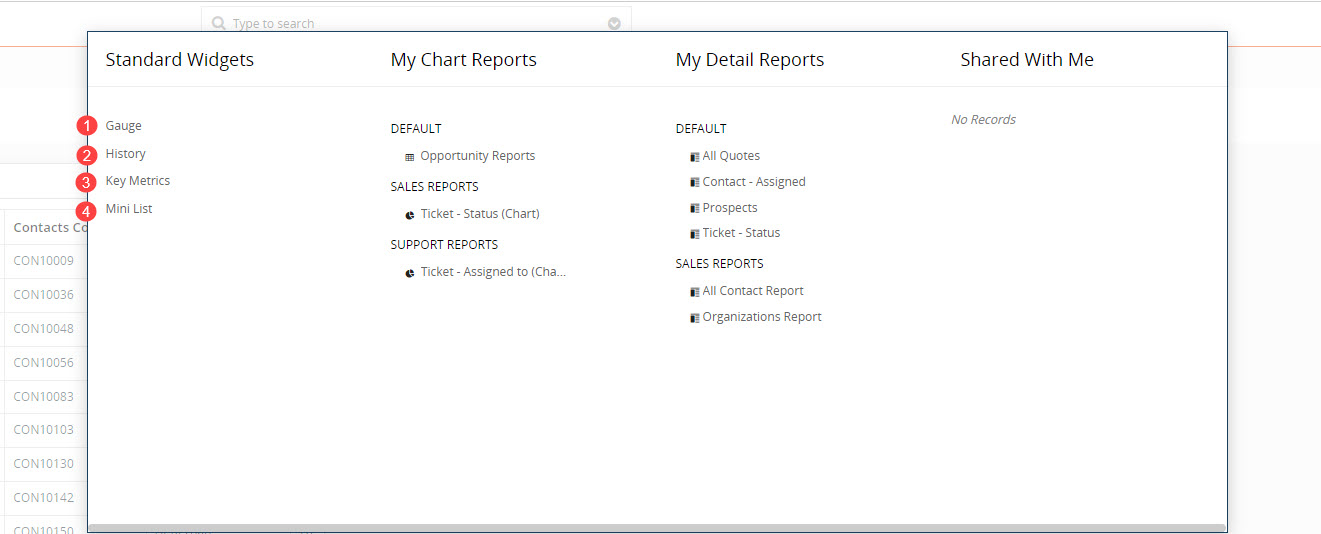
1. Gauge widget: This widget is used to show the sum, average, lowest value or highest value of a item in a report. For example you can use it to display the sum of all the opportunities of a certain status.
It will appear like this
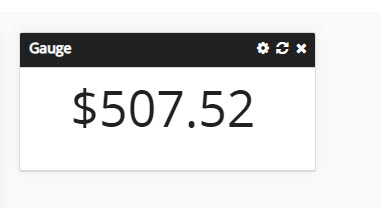
Following are details regarding its configurations
-
-
-
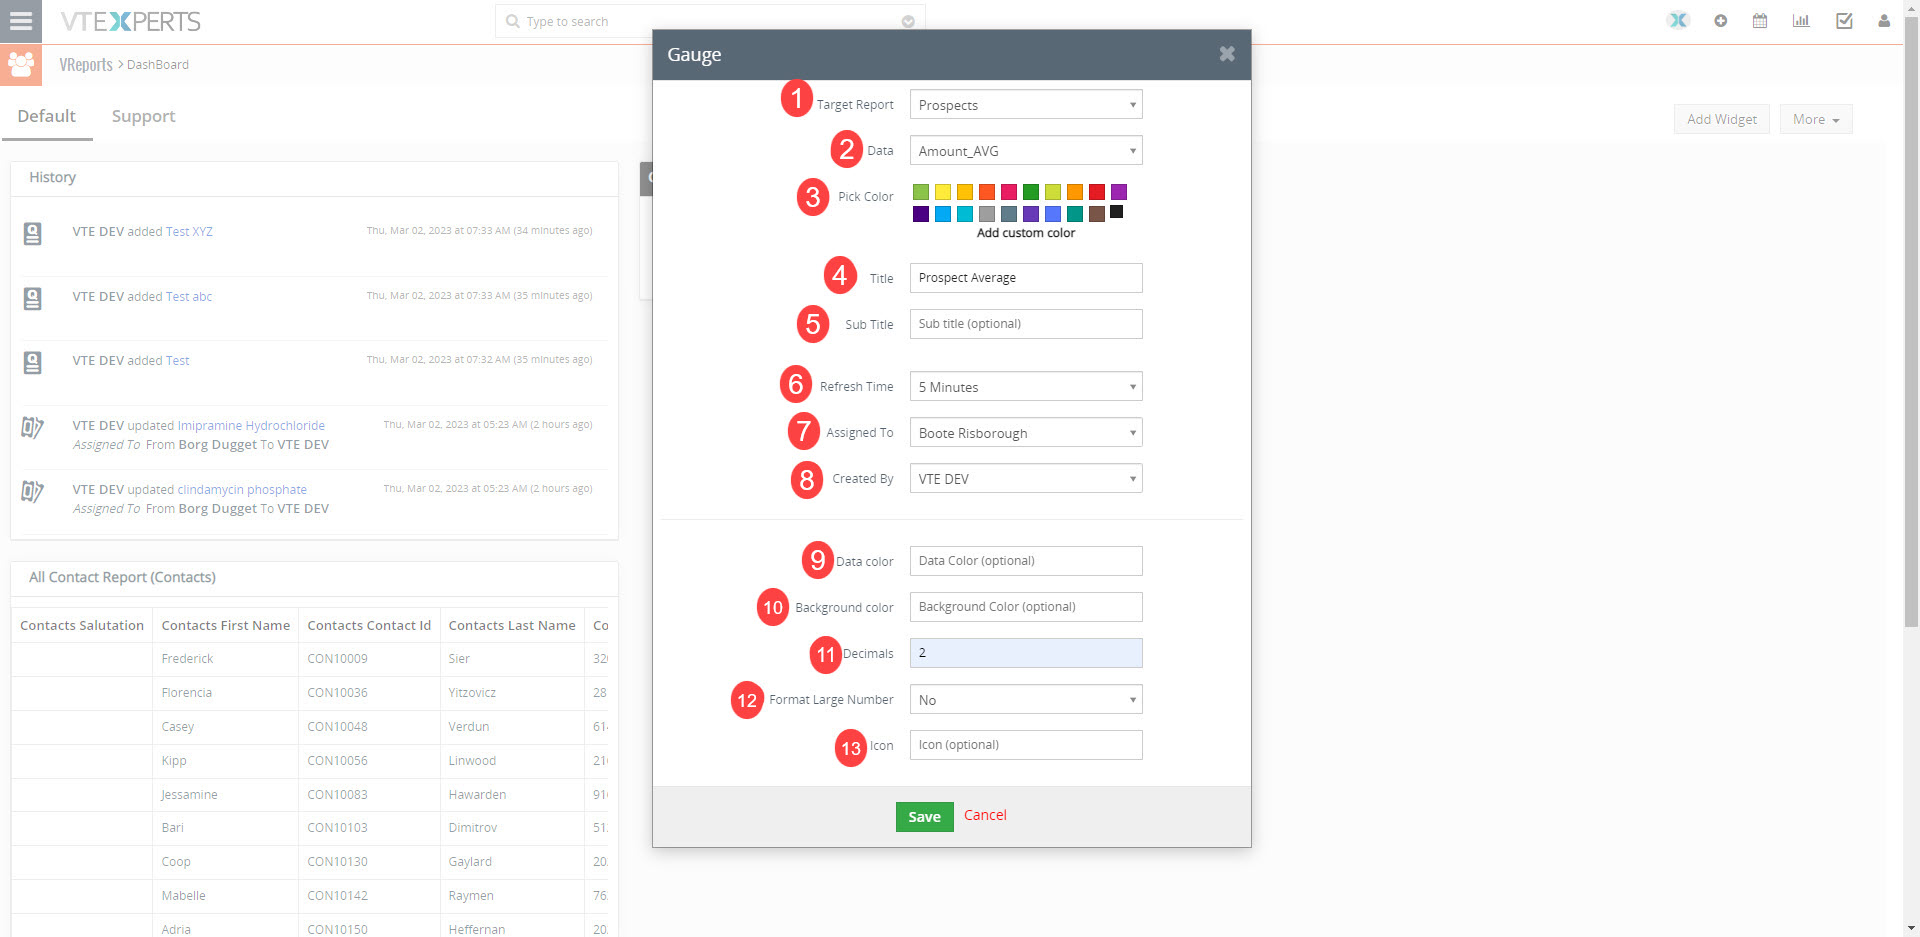
- Target report: Select the report for which the gauge will be created
- Data: Select the data field which will be displayed in the gauge. This field will only allow to select data if the report has calculation section configured
- Pick Color: Specify the color of the gauge
- Title: Provide the title of the gauge
- Sub-title: Provide the title of the gauge
- Refresh time: Configure the time after which the gauge will be refreshed
- Assigned to: User to whom the gauge is assigned to
- Created by: User who created the gauge
- Data color: Configure the color in which data will be displayed in gauge
- Background color: Configure the background color
- Decimal: Configure the decimal places
- Format large number: Feature under-development
- Icon: Feature under-development
-
-
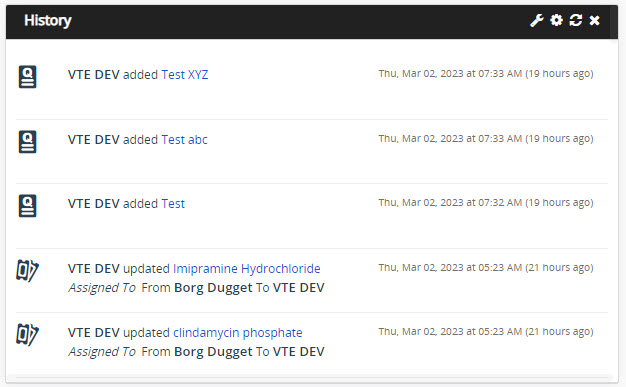
2. History widget: This widget shows the recent updates on the records
It will appear like this
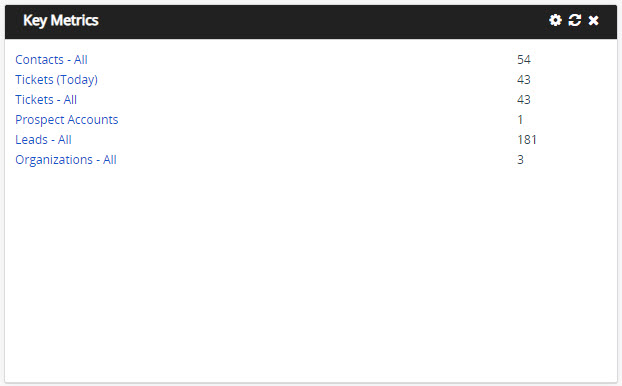
3. Key Metrics: This widget is used to give a snapshot of the key metrics. Configuring it is a quite easy and straight forward
It will appear like this
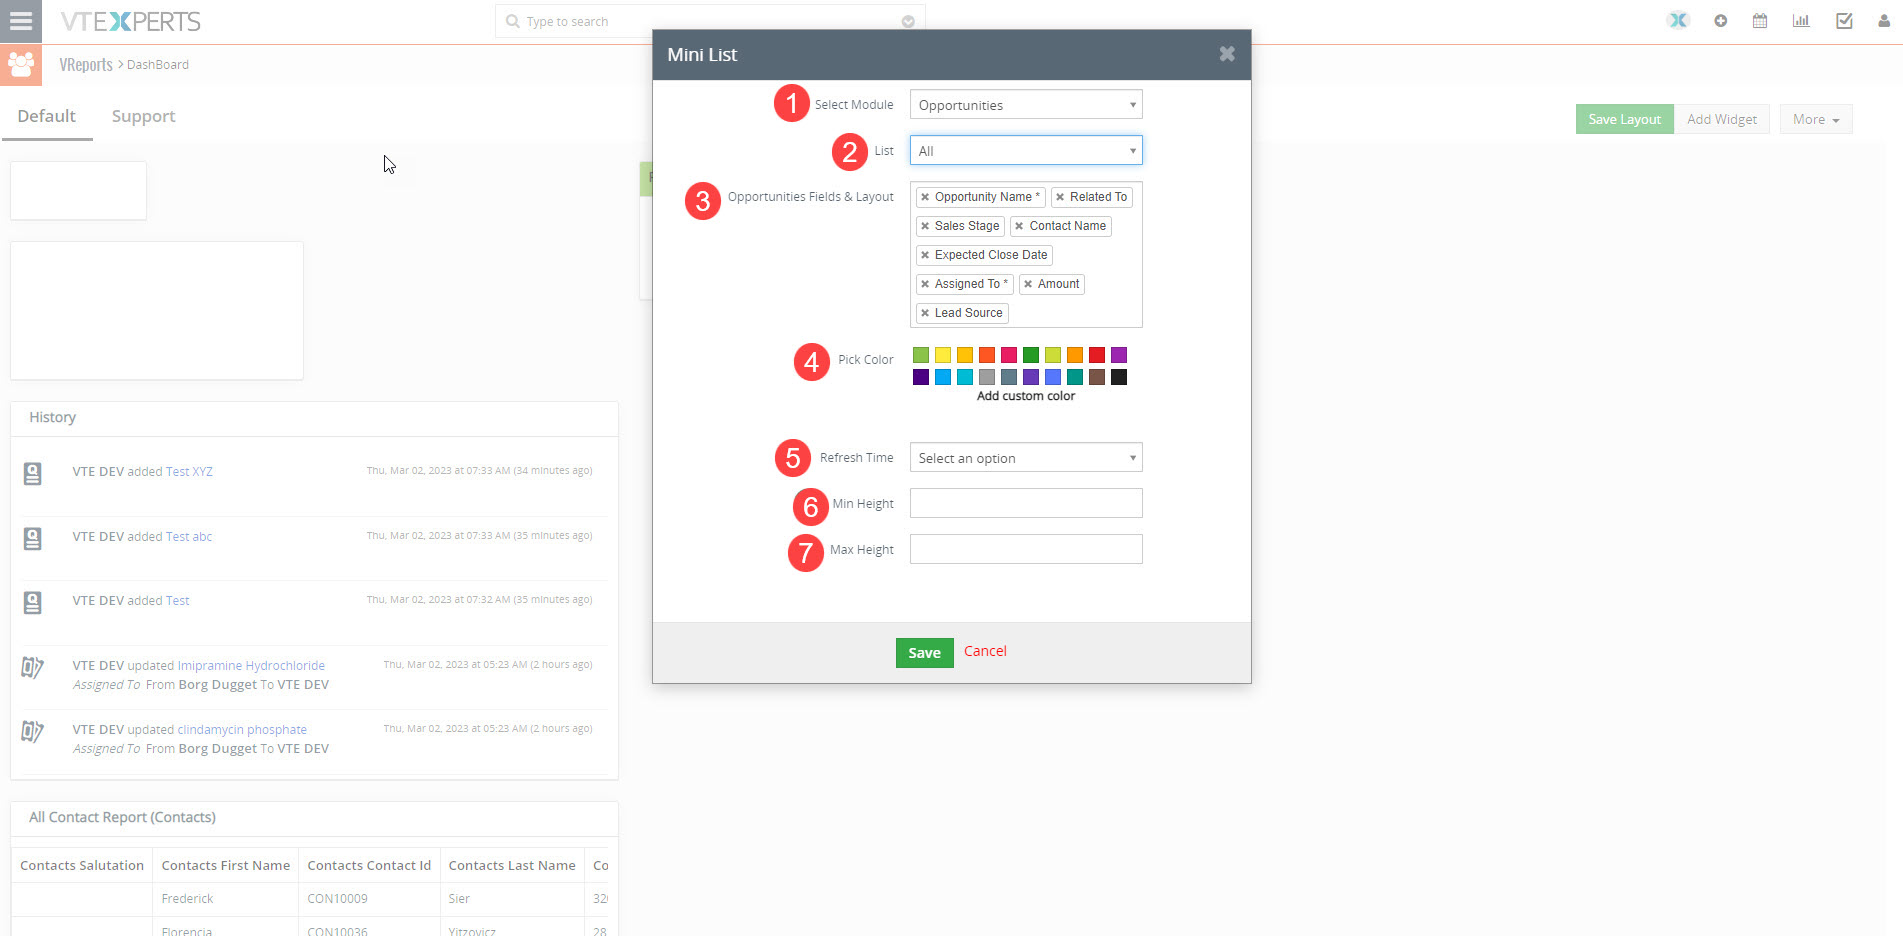
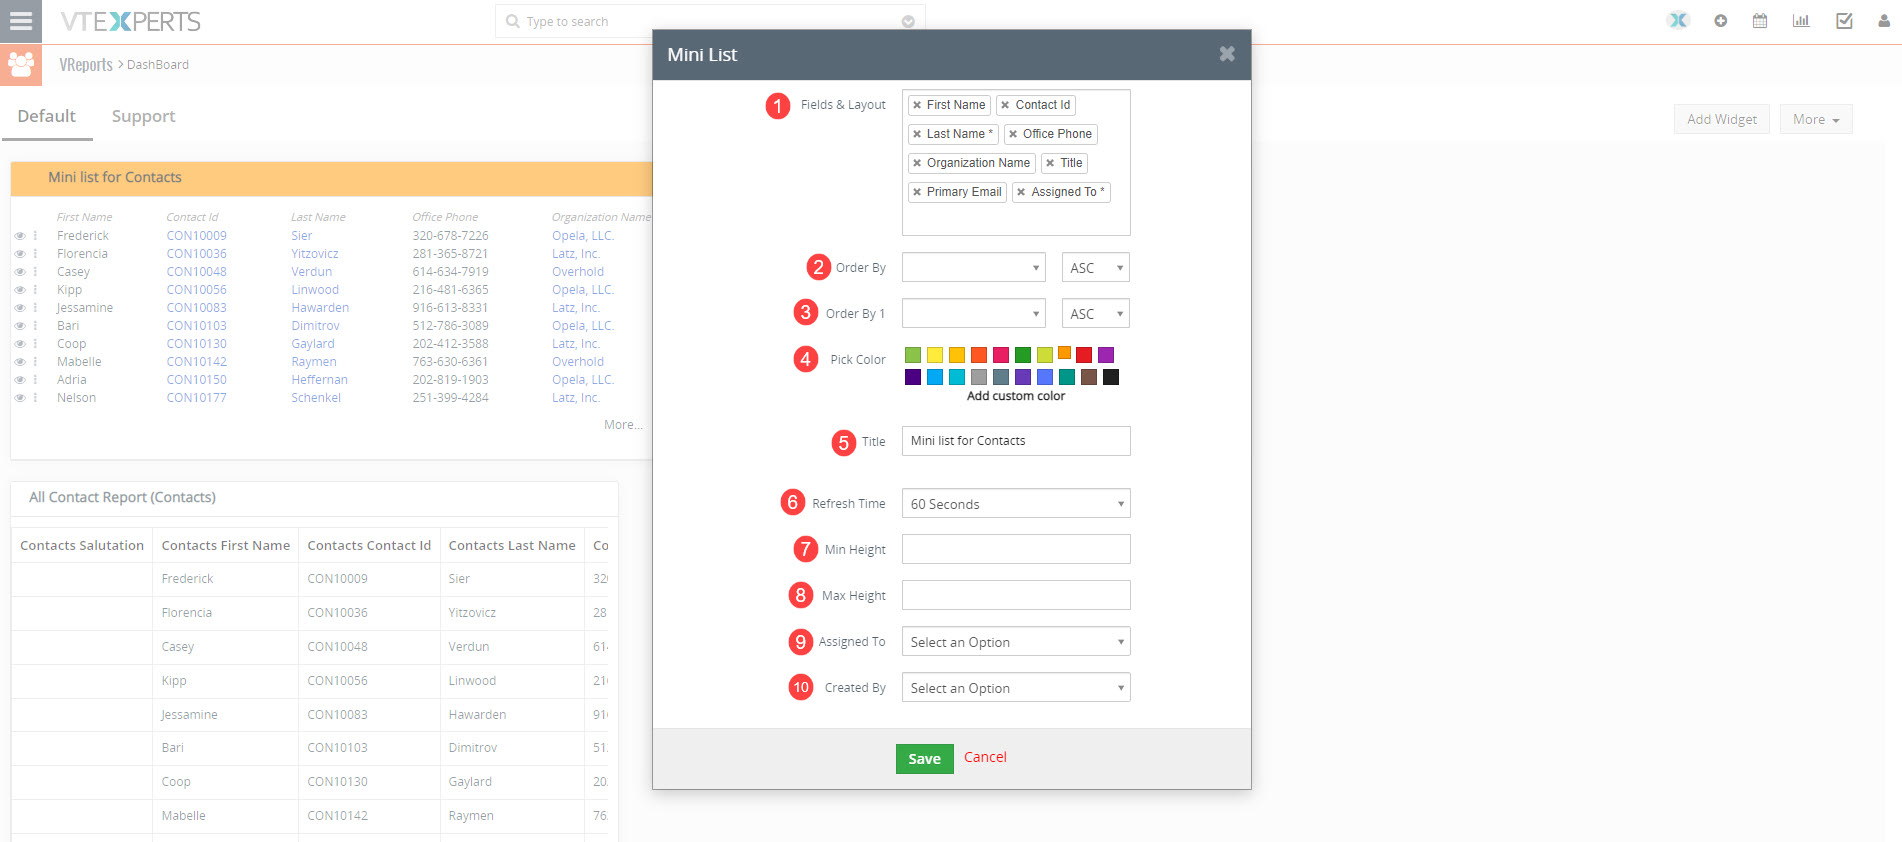
4. Mini List: Once you click the mini-list following pop-up will appear
-
-
- Select Module: which will open a pick list from where you can select any module
- List: where you can specify the category.
- Fields & Layout: where you can customize the Fields to your desired requirements by adding more fields or removing them or changing the order.
- Pick Color: which allows you to select any custom color
- Refresh Time: Which will refresh the “Mini list” with the time you specify.
- Min Height: The lest number of records you want to show.
- Max Height: The maximum number of records you want to show on the dashboard
-
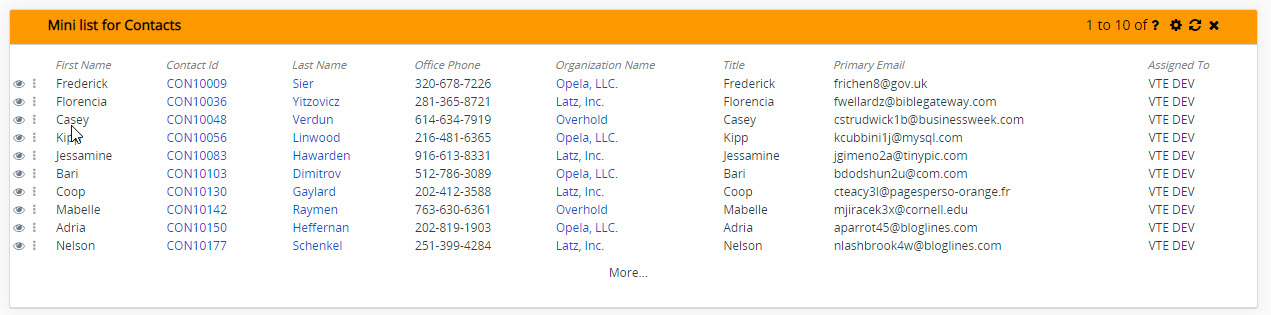
Hit Save to create the List on your Dashboard.
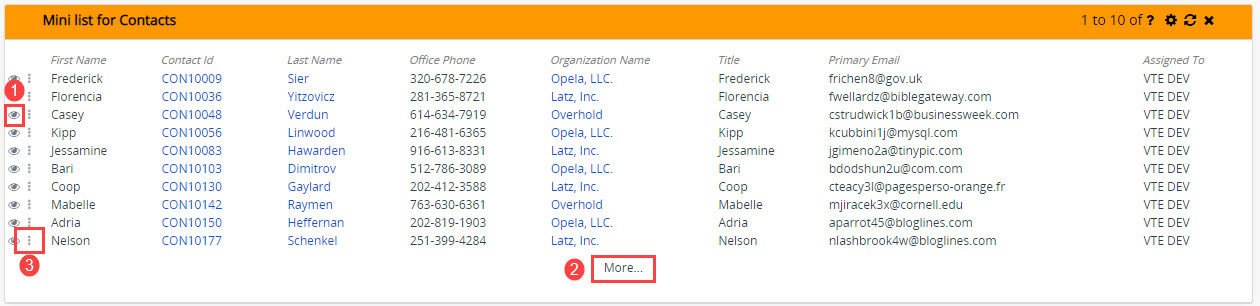
Here is how mini-list will appear on the dashboard
Advantages of Having Mini List on Dashboard
Having Mini List gives you the following benefits
-
-
- You are able to see all the mandatory fields like Progress, Priority, Status.
- edit them with a single click.
- Respond, Delete comment in no time.
- Reduces the time and man-work to manually go to the specific module and find the records in order to check or alter them.
- Efficient and easy to use.
- Many operations can be dealt with simultaneously.
-
Edit the Widget
In order to edit the widget you can need to hover over the widget and click on the settings icon on the top right of the “Mini List”.
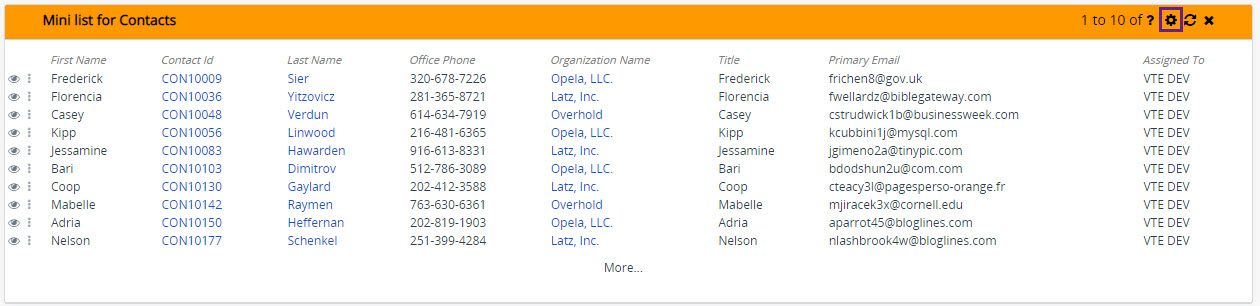
Here you can edit the the settings which include.
-
-
- Fields & Layout: where you can customize the Fields to your desired requirements by adding more fields or removing them or changing the order.
- Order By: You can categorize and arrange the record based on priority, Name, Status etc. and can arrange them either by ascending or descending order.
- Order By 1: You are allowed to arrange the same record by more than one category simultaneously.
- Pick Color: which allows you to select any custom color
- Title: Which allows you to add custom title to the list.
- Refresh Time: Which will refresh the “Mini list” with the time you specify.
- Min Height: The lest number of records you want to show.
- Max Height: The maximum number of records you want to show on the dashboard.
- Assigned to: User to whom the gauge is assigned to
- Created by: User who created the gauge
-
Actions
You can also interact with the Mini List by clicking the “Details” or “Quick View” Icon.
-
-
- Quick view: Takes you to the quick overall view of the records from where you can edit or check the details related to it and also add comments.
image 25 - More: By clicking on “More” you are allowed to
- Settings: Settings button will show two options related to the records which are as follow
Image 24- Details: Which will take you to the detail view of the record
- Edit: Which allows you to edit the record.
- Quick view: Takes you to the quick overall view of the records from where you can edit or check the details related to it and also add comments.
-
Custom Buttons: The Mini List is integrated with Buttons Extension also, which can also be displayed along with the quick view and more
Layout of the Dashboard
You can change the layout and size of every widget on your dashboard.
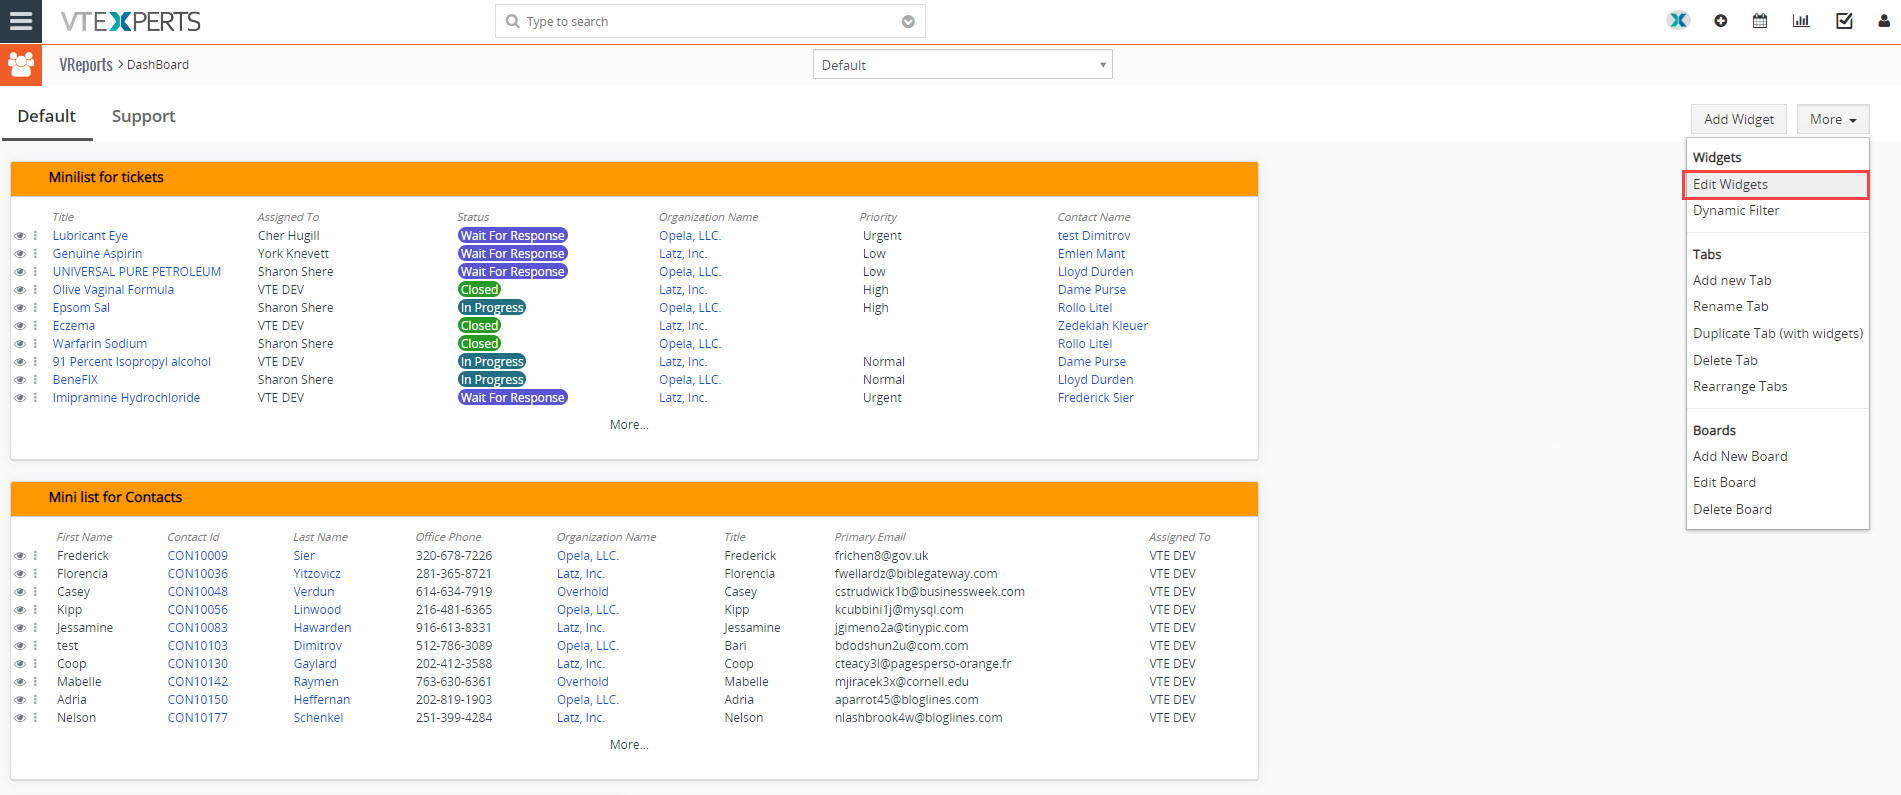
In order to do so you have to Click on More ▾ on the top right corner and select Edit Widgets .
You can then Drag the Widget horizontally or vertically, you will also be able to change the size.
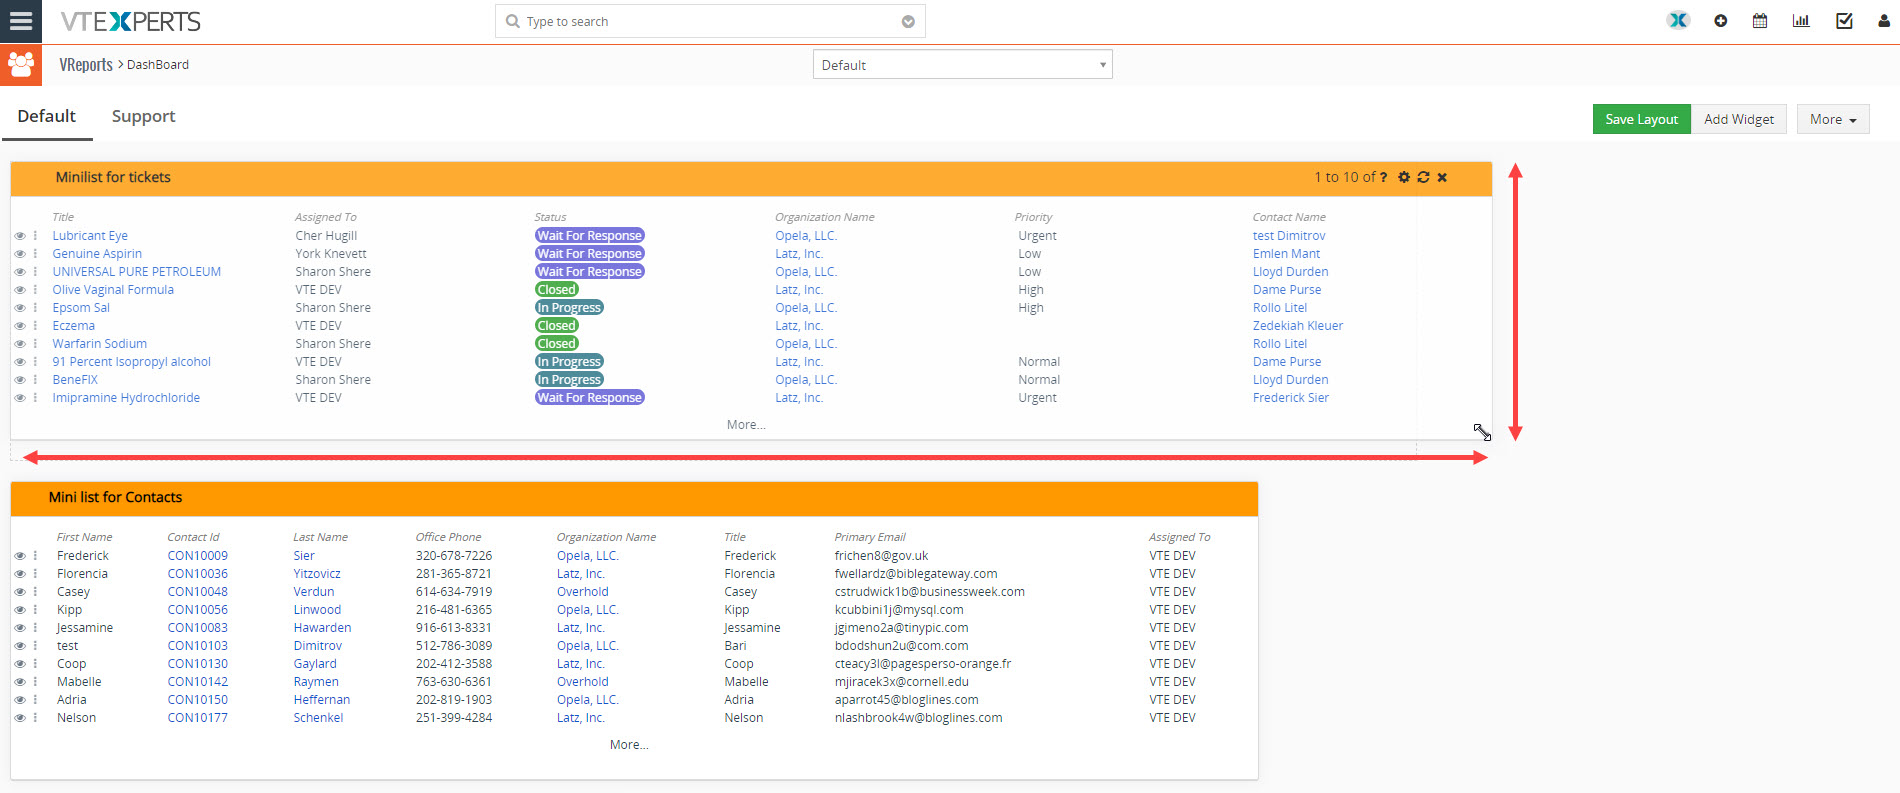 After resizing the widget as per your requirement Save Layout which will then save it.
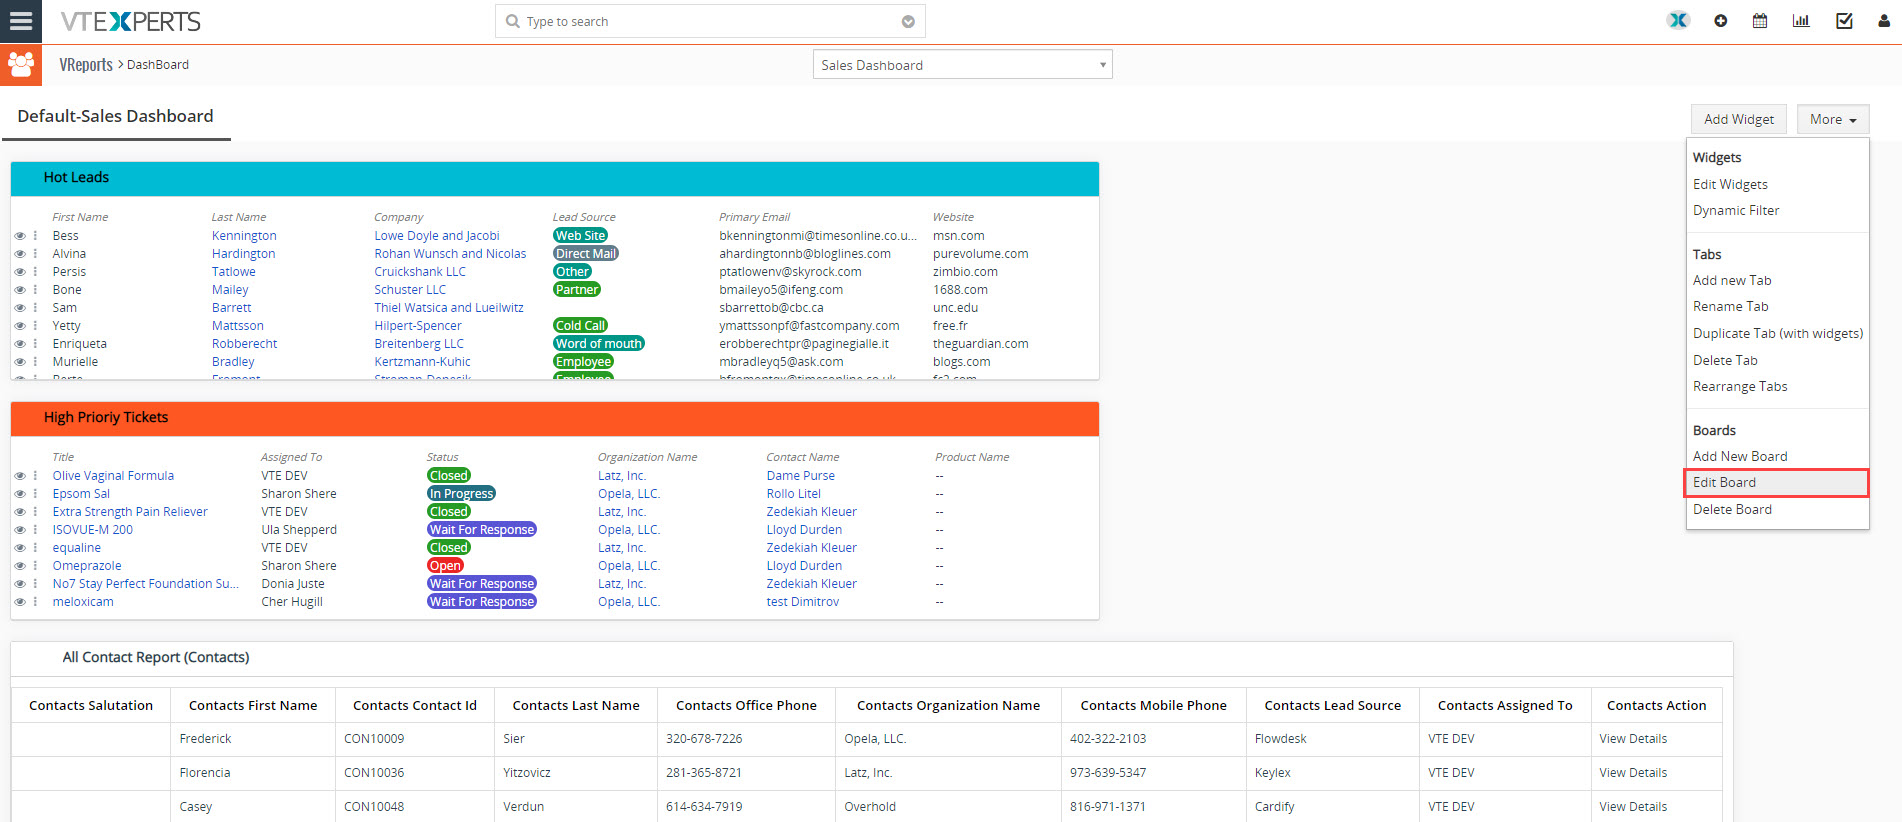
Boards
From the Main Dashboard you can create as many Boards as you want. To create a board you need to go to “More” and select “Add Board” from the pick list.
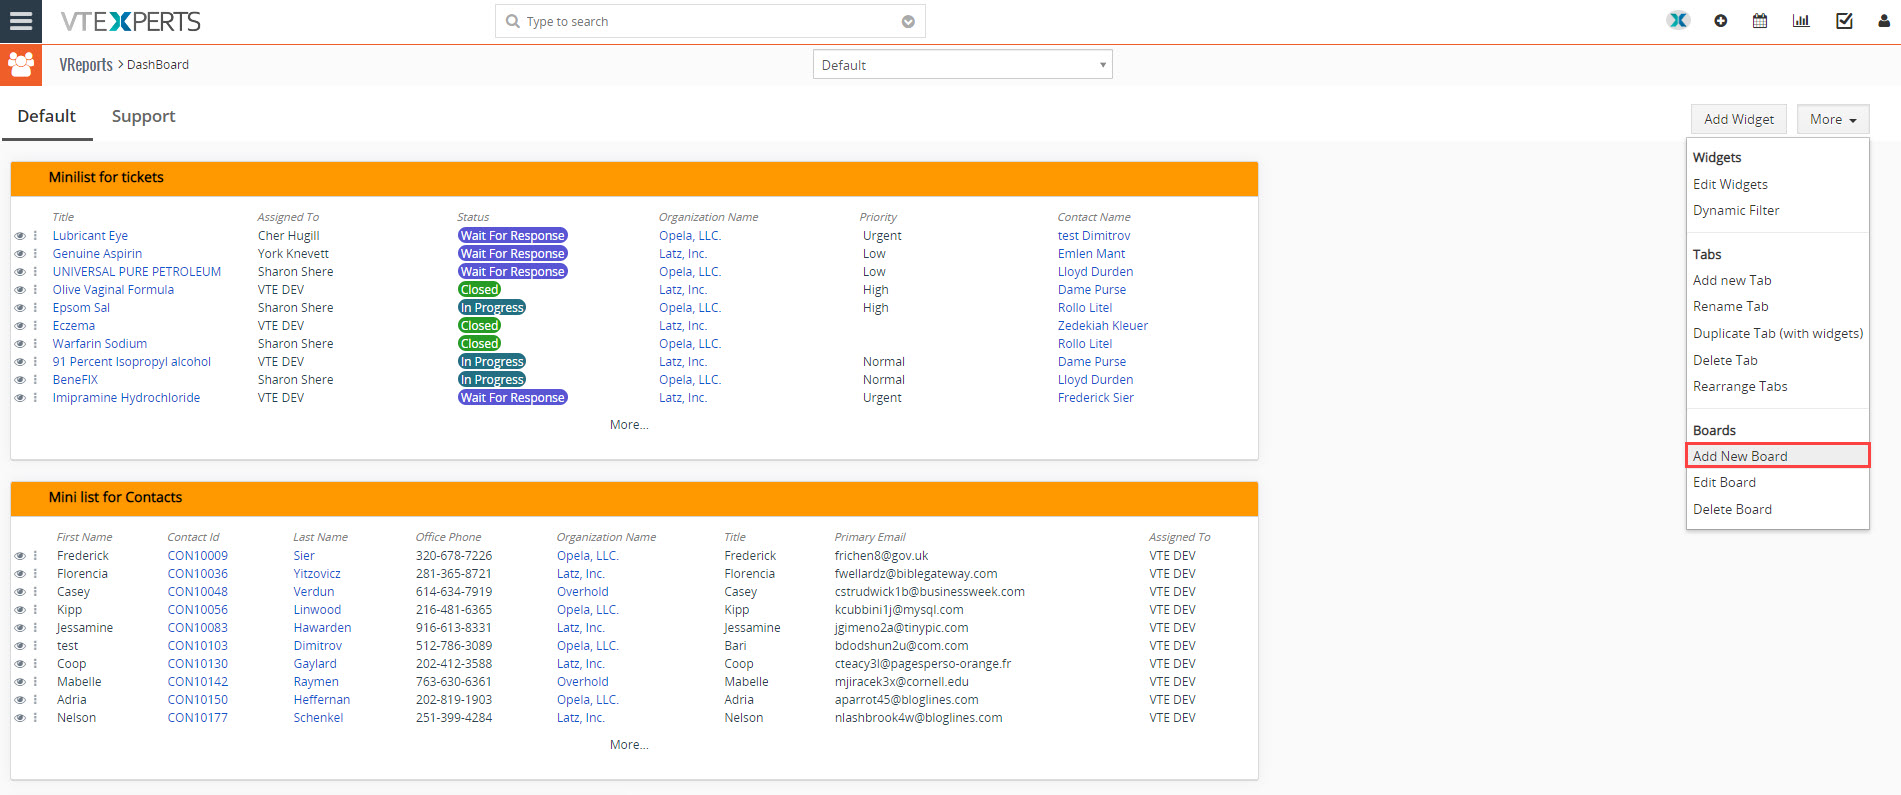
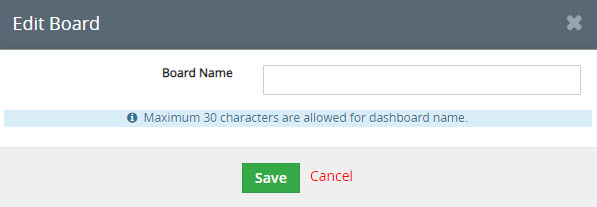
Clicking on “Add board” will bring a pop up where you can decide the name you want for the board, and hit “Save”.
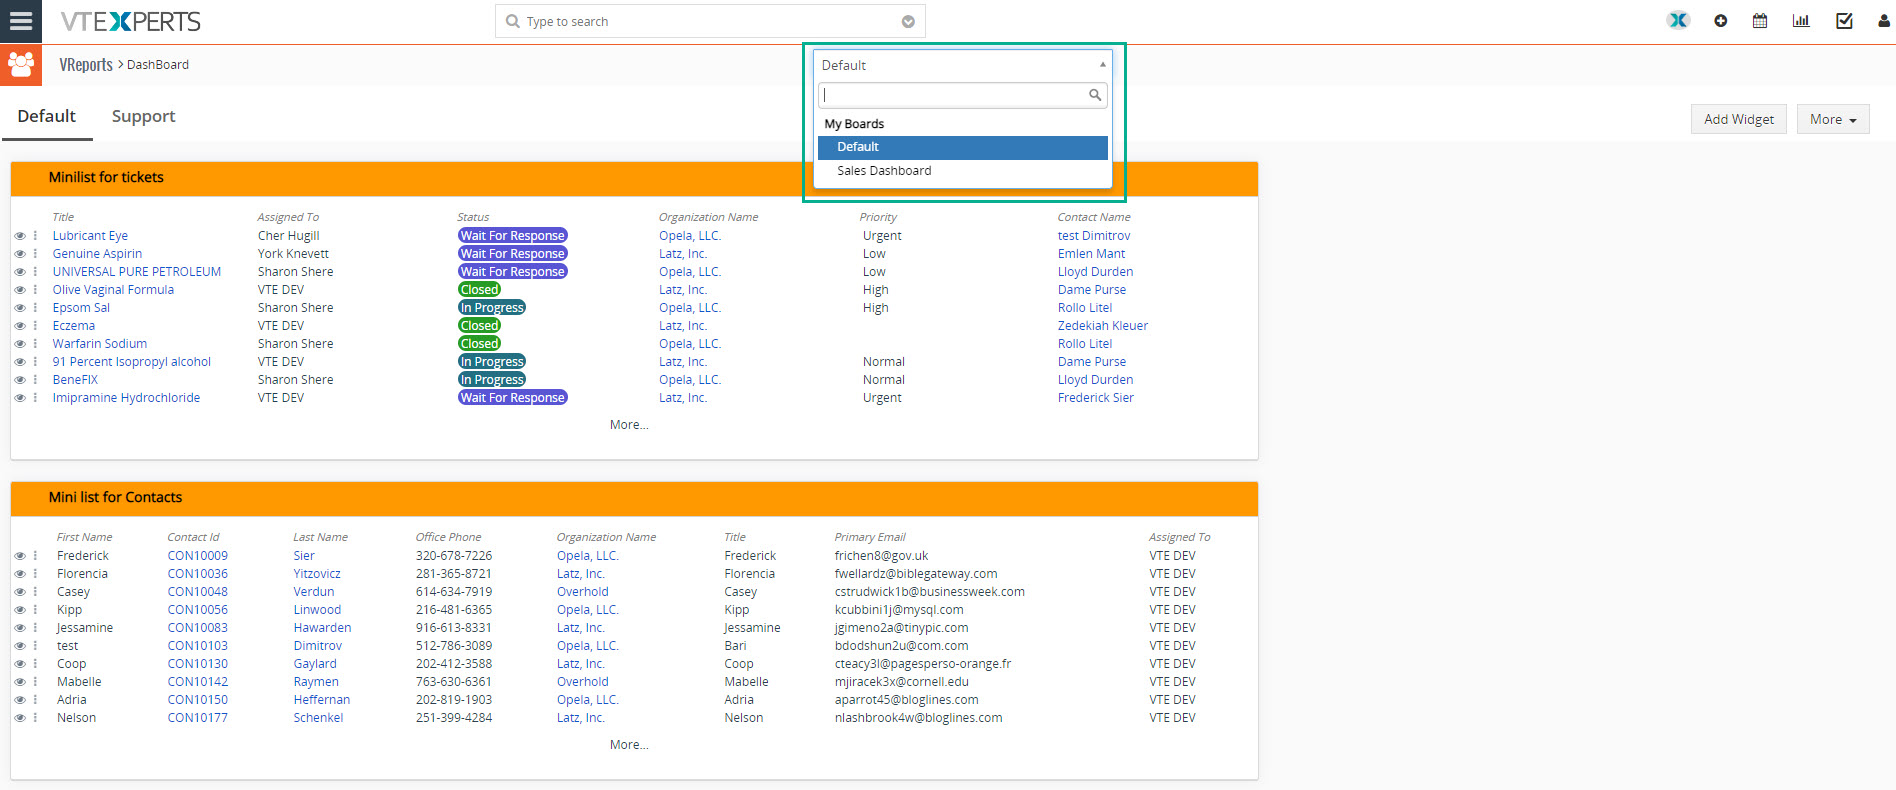
This will create a new board which you can access by clicking the drop down menu on the top.
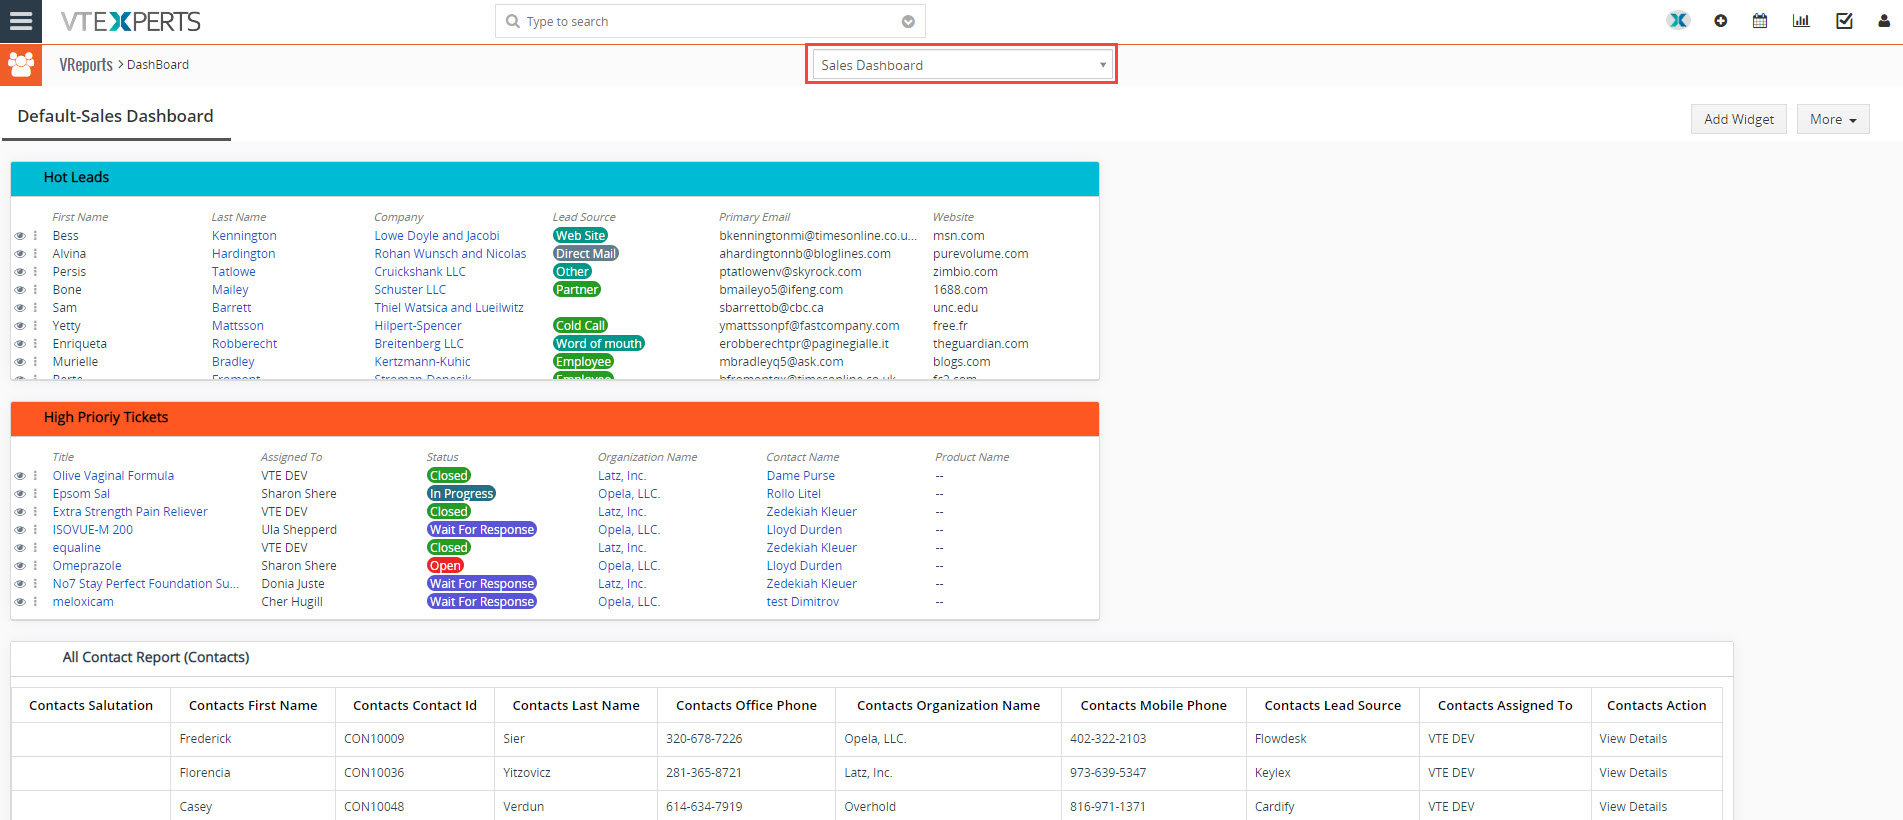
Selecting “Sales Dashboard” will take you to the new board where you can customize it accordingly.
To configure the board hover over “Menu” and then select “Edit Board”
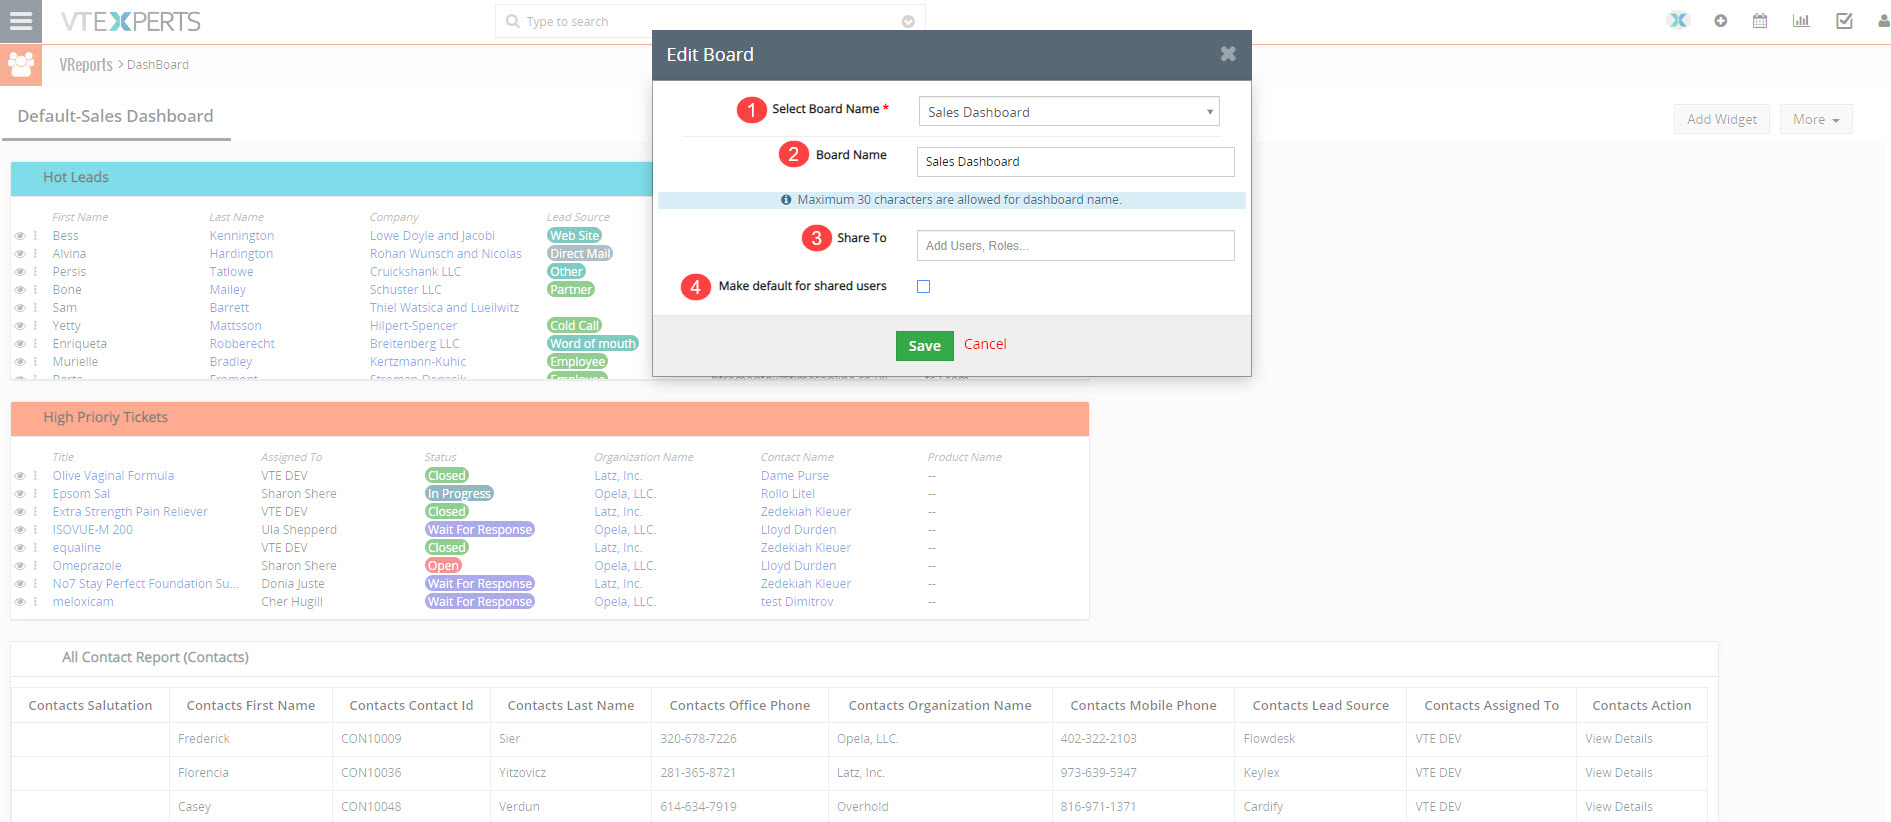
Following configuration window will pop-up
-
-
- Select Board Name: Select the board you want to edit
- Board Name: You can make the changes in the dashboard name from here
- Share to: Specify the users and groups that you want to share dashboard with
- Make default for the shared user: By checking the box the bord will be made default board for the users to whom the board is shared with
-
Dynamic Filters
Dynamic Filter helps you in applying filter to all widgets present on the dashboard.
To apply a Dynamic Filter on the Dashboard you need to go to More ▾ and select Dynamic Filter in the Pick List.
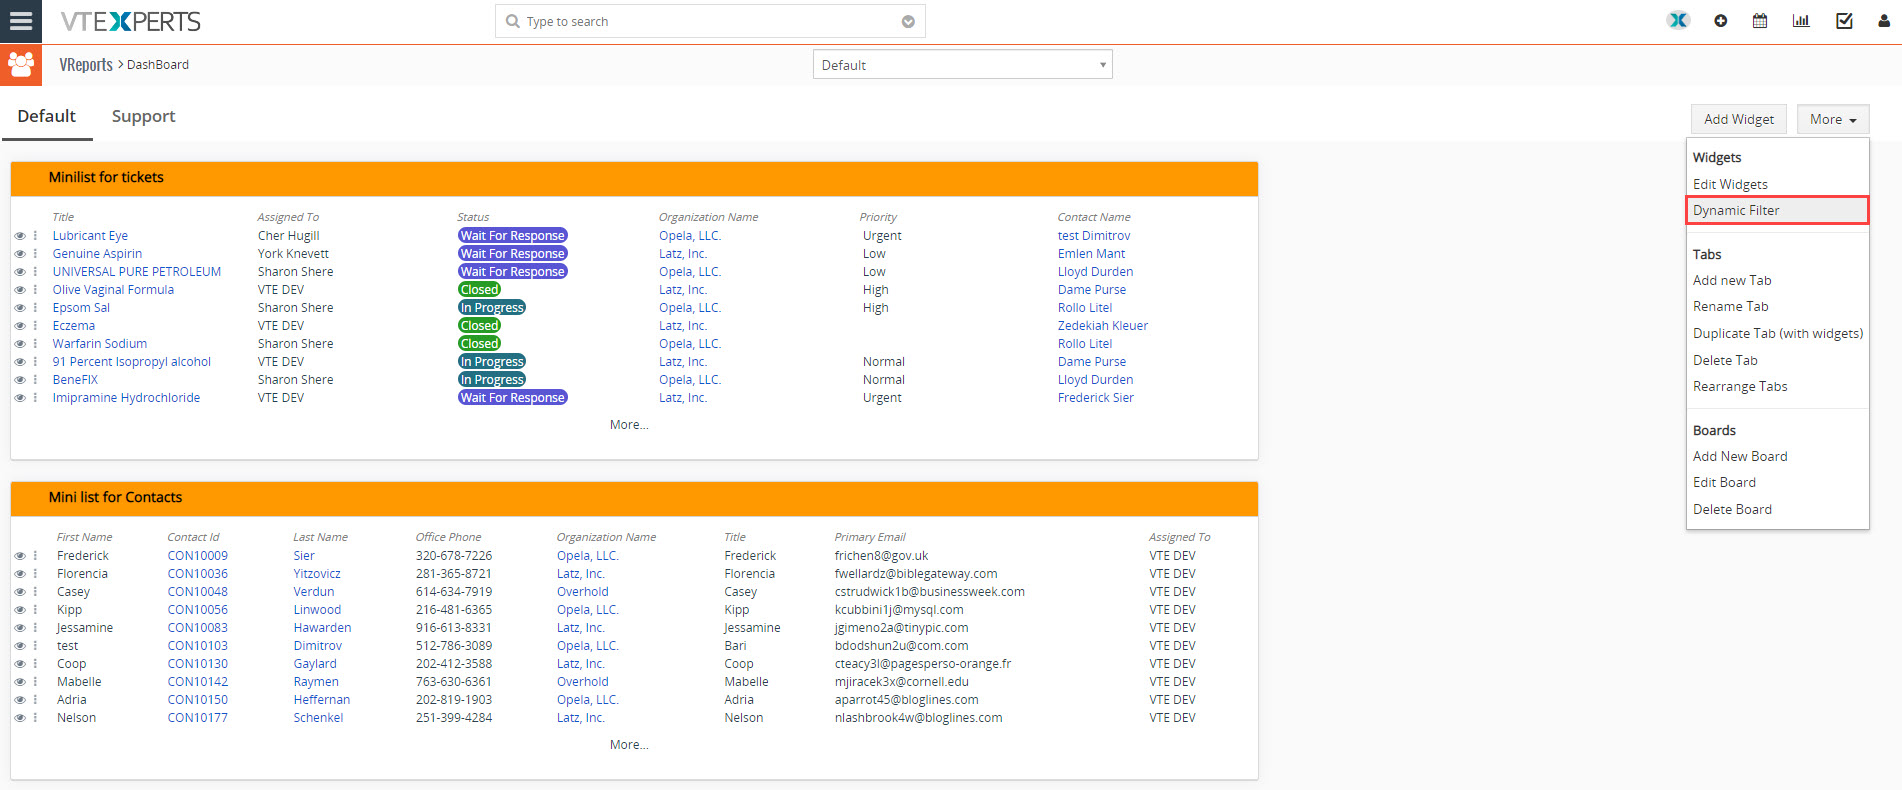
Bringing you to a pop up where you can select how you want to apply the filter.
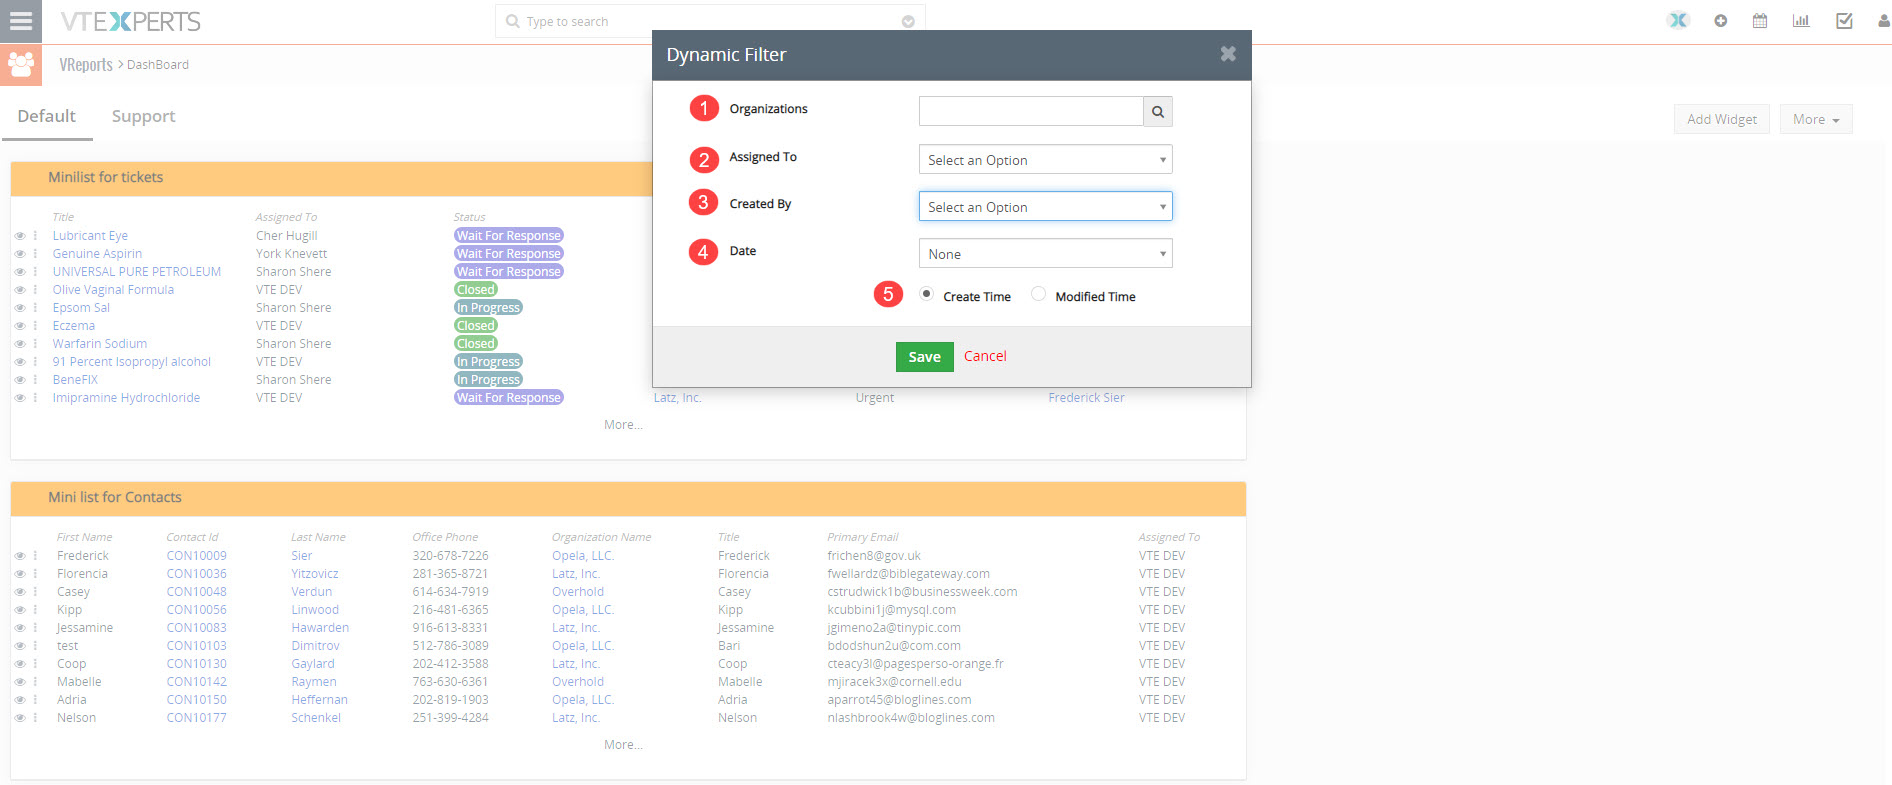
The Dynamic filter pop up will include the fields like
-
-
- Organizations: You can apply the filter related to an organization, selecting a particular organization will only show records related to it.
- Assigned To: From the pick-list you can select an individual or a group, which will only show the records related to them.
- Create by: User who created the dynamic filter
- Date: You can select a customized date to filter out the records e.g. last 30 days, last week or the upcoming month etc. selecting none will show all the records neglecting the time limit.
- Created time/Modified time: Time filter based on created time or modified time
-
Hit Save in order to save the changes and apply the dynamic filter.
It will only show the tasks which are assigned to that particular user or group. As shown below.
Duplicate Tab
You can also Duplicate the tab which will copy all the widgets from the current tab to another where you can apply another Dynamic Filter.
In order to Duplicate the current tab click on More ▾ and then Duplicate Tab
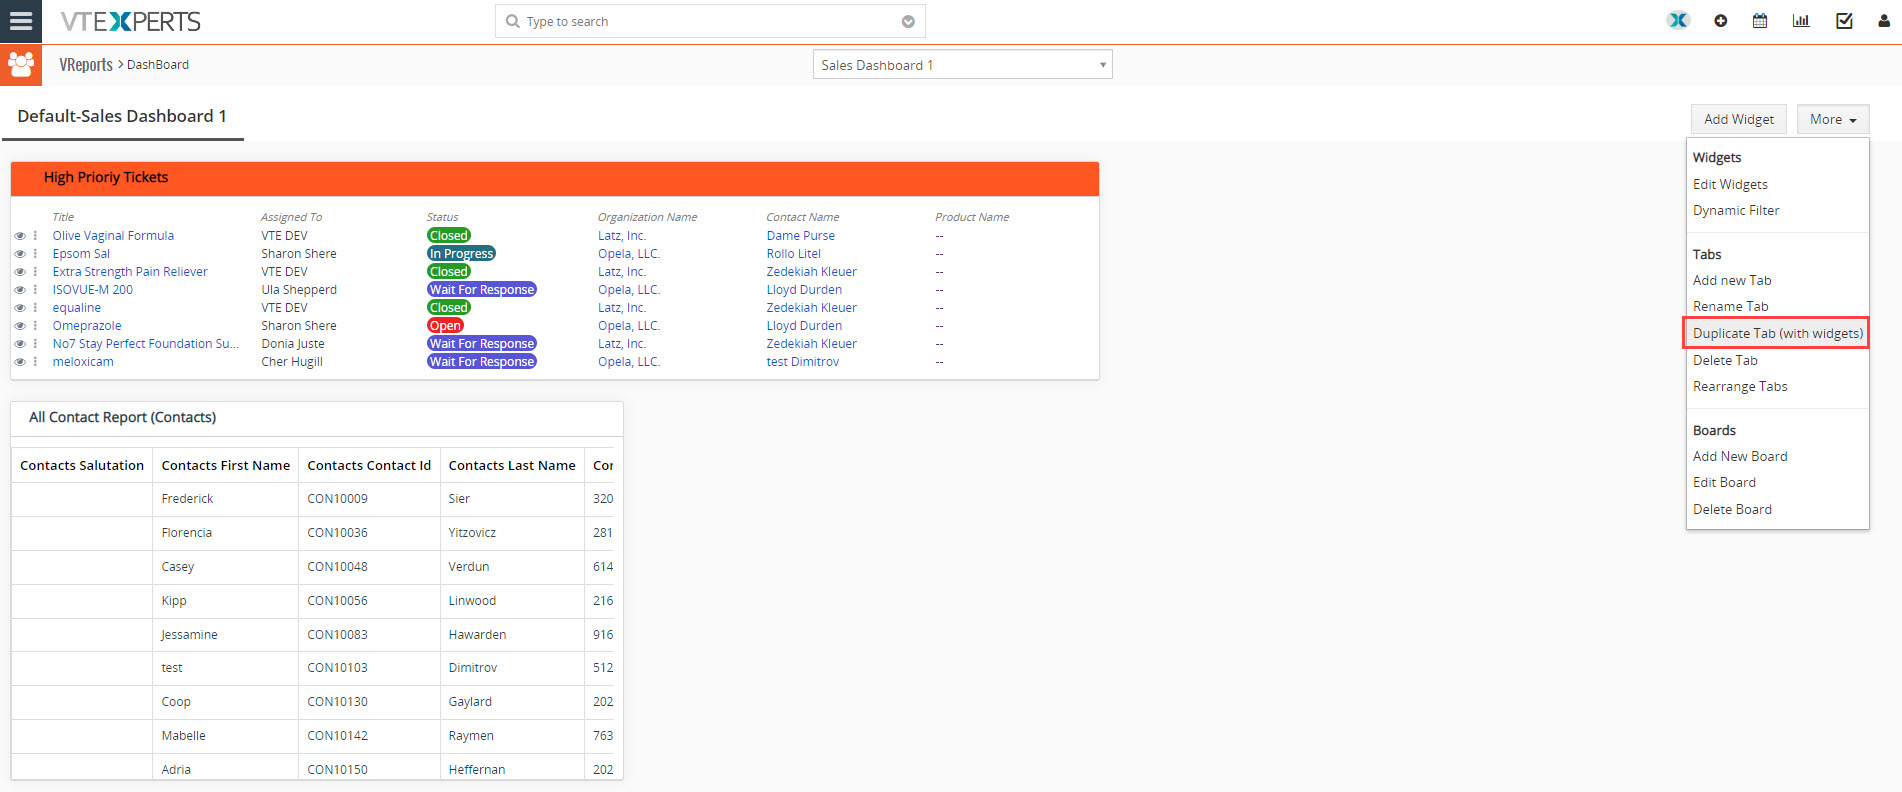
Which will open a pop up as follow
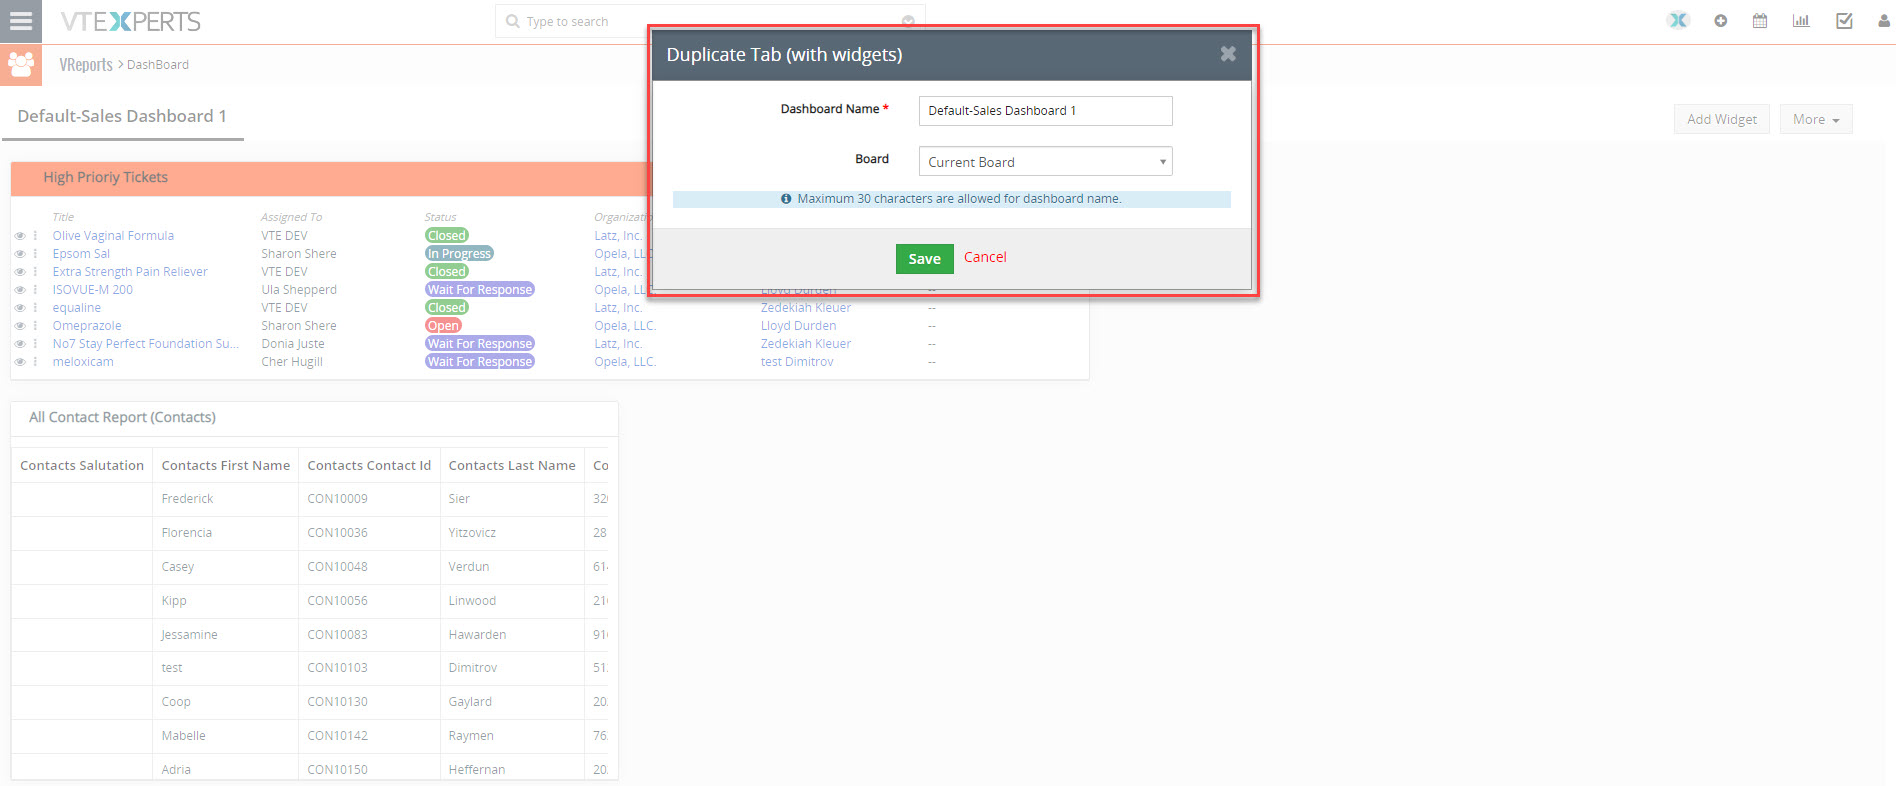
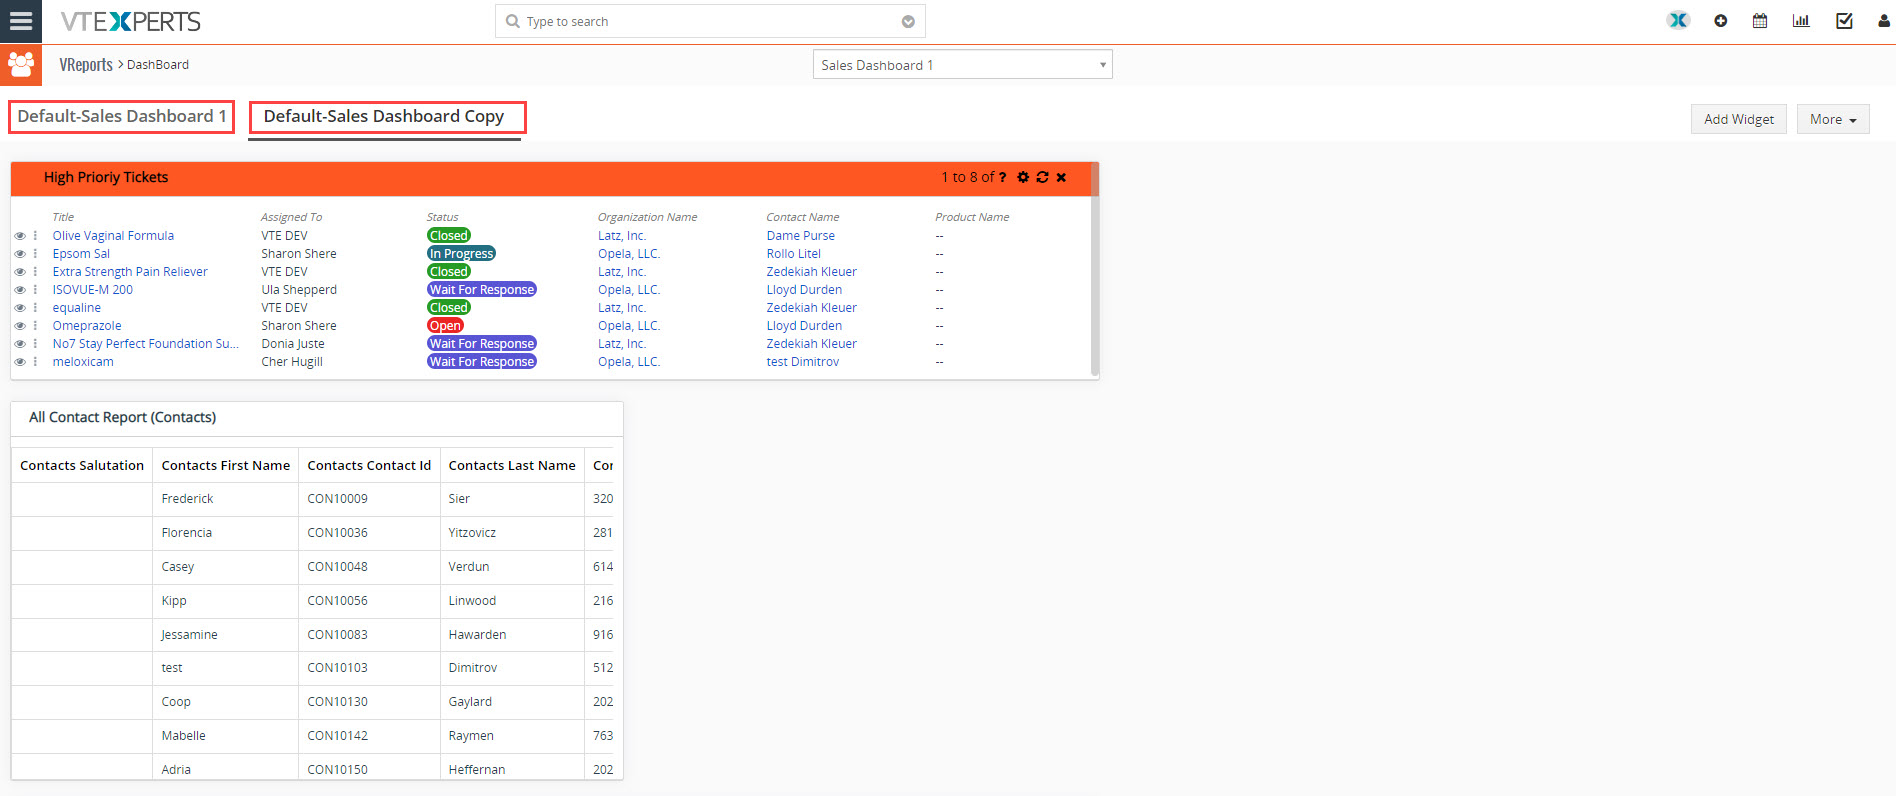
Clicking on Save will create a new tab for you which will include all the widgets and reports as the other tab and you can apply a different dynamic filer on it.
Set VReports Dashboard As Default Landing Page
You can also set VReports Dashboard as default landing page. Making VReports as default landing page is not a built in feature of the extension but is a workaround and you need to run the query for it.
Modify config.inc.php and update to:
$default_module = 'VReports';
Modify includes/main/WebUI.php and replace:
if($module == 'Calendar') {<br />
// To load MyCalendar instead of list view for calendar<br />
//TODO: see if it has to enhanced and get the default view from module model<br />
$view = 'Calendar';<br />
}
With:
if($module == 'Calendar') {<br />
// To load MyCalendar instead of list view for calendar<br />
//TODO: see if it has to enhanced and get the default view from module model<br />
$view = 'Calendar';<br />
}elseif($module == 'VReports'){<br />
$view = 'DashBoard';<br />
}
For vtiger 7.3
If using Vtiger 7.3 Modify includes/main/WebUI.php and replace:
if ($this->hasLogin()) {<br />
$defaultModule = $currentUser->defaultlandingpage;<br />
$moduleModel = Vtiger_Module_Model::getInstance($defaultModule);<br />
if(!empty($defaultModule) && $defaultModule != 'Home' && $moduleModel && $moduleModel->isActive()) {<br />
$module = $defaultModule; $qualifiedModuleName = $defaultModule; $view = 'List';<br />
if($module == 'Calendar') {<br />
// To load MyCalendar instead of list view for calendar<br />
//TODO: see if it has to enhanced and get the default view from module model<br />
$view = 'Calendar';<br />
}<br />
} else {<br />
$module = 'Home'; $qualifiedModuleName = 'Home'; $view = 'DashBoard';<br />
}<br />
} else {<br />
$module = 'Users'; $qualifiedModuleName = 'Settings:Users'; $view = 'Login';<br />
}
With:
if ($this->hasLogin()) {<br />
//$defaultModule = $currentUser->defaultlandingpage;<br />
$defaultModule = vglobal('default_module');<br />
$moduleModel = Vtiger_Module_Model::getInstance($defaultModule);<br />
if(!empty($defaultModule) && $defaultModule != 'Home' && $moduleModel && $moduleModel->isActive()) {<br />
$module = $defaultModule; $qualifiedModuleName = $defaultModule; $view = 'List';<br />
if($module == 'Calendar') {<br />
// To load MyCalendar instead of list view for calendar<br />
//TODO: see if it has to enhanced and get the default view from module model<br />
$view = 'Calendar';<br />
}elseif($module == 'VReports'){<br />
$view = 'DashBoard';<br />
}<br />
}<br />
} else {<br />
$module = 'Users'; $qualifiedModuleName = 'Settings:Users'; $view = 'Login';
For vtiger 7.4
For setting up VReports and Dashboards as default in Vtiger 7.4, kindly check the following
information
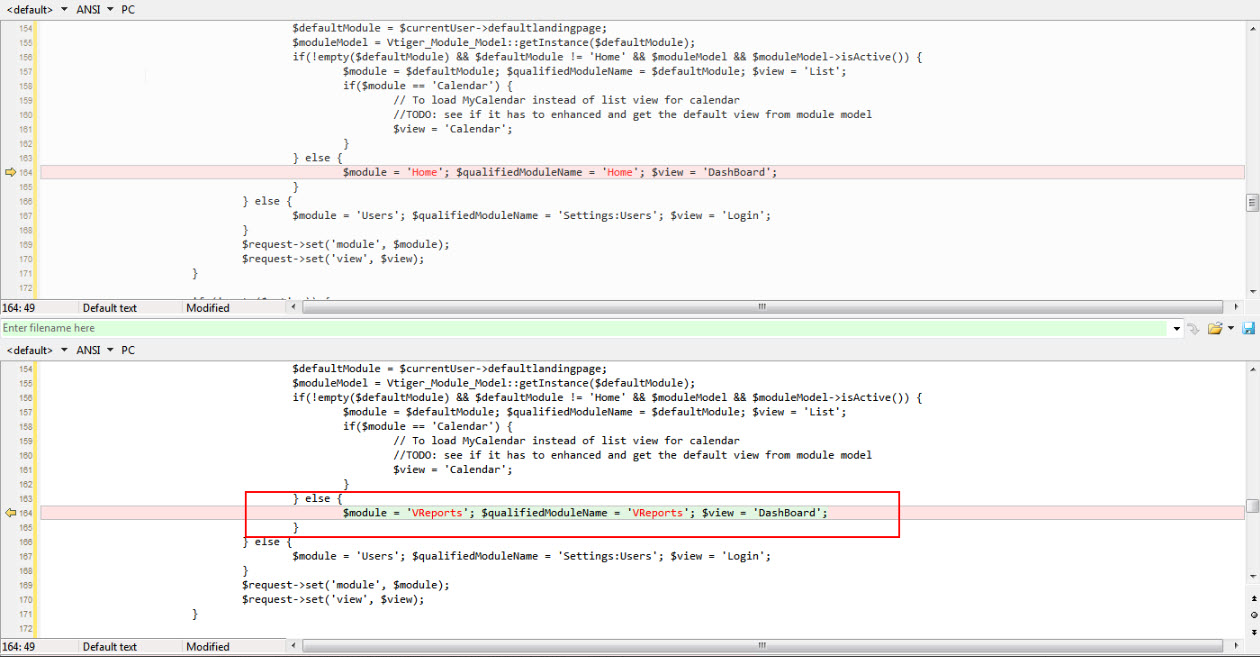
Modify Core file.
File: ../your_vtigercrm_folder/includes/main/WebUI.php
Check the code around line 164, you will find the following code
$module = 'Home'; $qualifiedModuleName = 'Home'; $view = 'DashBoard';
Replace the above mentioned code with:
$module = 'VReports'; $qualifiedModuleName = 'VReports'; $view = 'DashBoard';
Here is a screenshot of actual code for better understanding
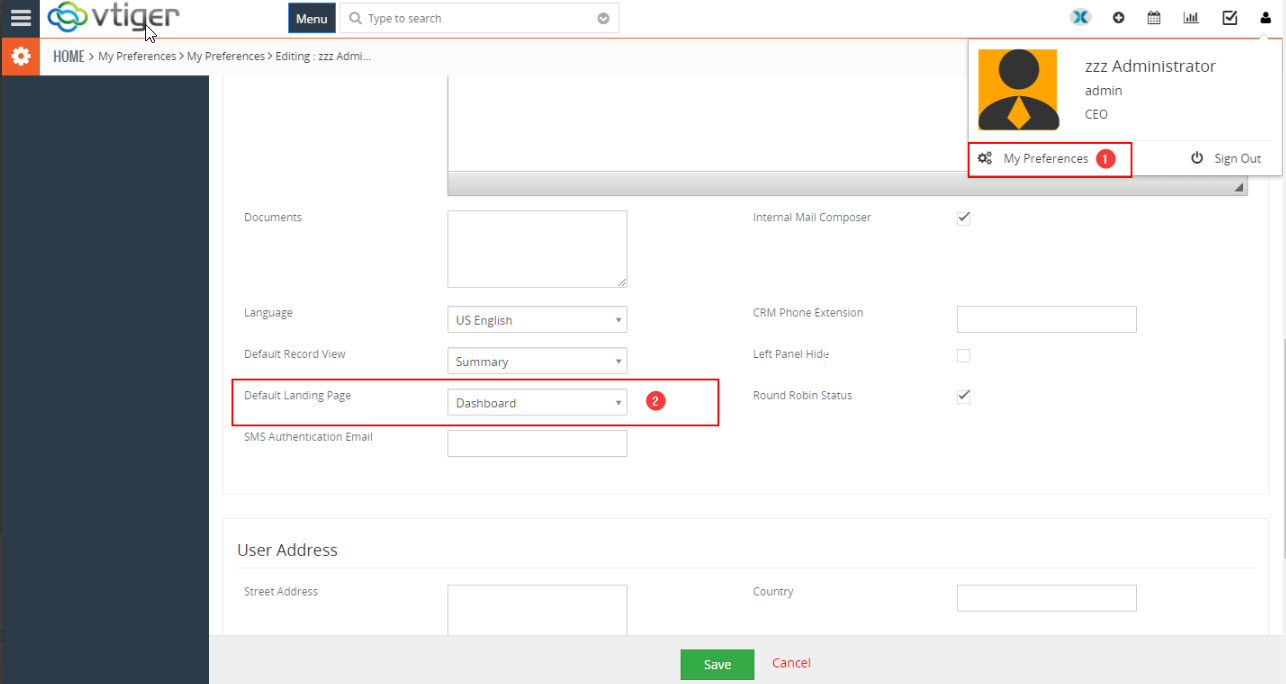
How to update User Default Landing Page.
-
- Go to My Preferences
- Edit User
- Scroll down to “Default Landing Page” field and set the value to “Dashboard”.
Here is a screenshot for reference
For more resources related to Vreports & Dashboards, please visit the Link