
VTiger Professional Reports is a tool built to fulfill the needs of all the businesses looking to run complicated, but easy to read reports. It includes a report builder which is capable of creating detailed, summary, pivot, chart reports. All the charts and reports can be placed on the dashboard for quick & easy access.
Extension includes a lot of unique features such as drag & drop interface, completely redesigned interface for creating reports, highlighting columns, up to 3 charts per report, both detail and chart reports added on the homepage dashboard, custom permissions, scheduled reports & much more.
Configuration
In the Configuration panel of VTE Reports,
Add Report: to create new reports
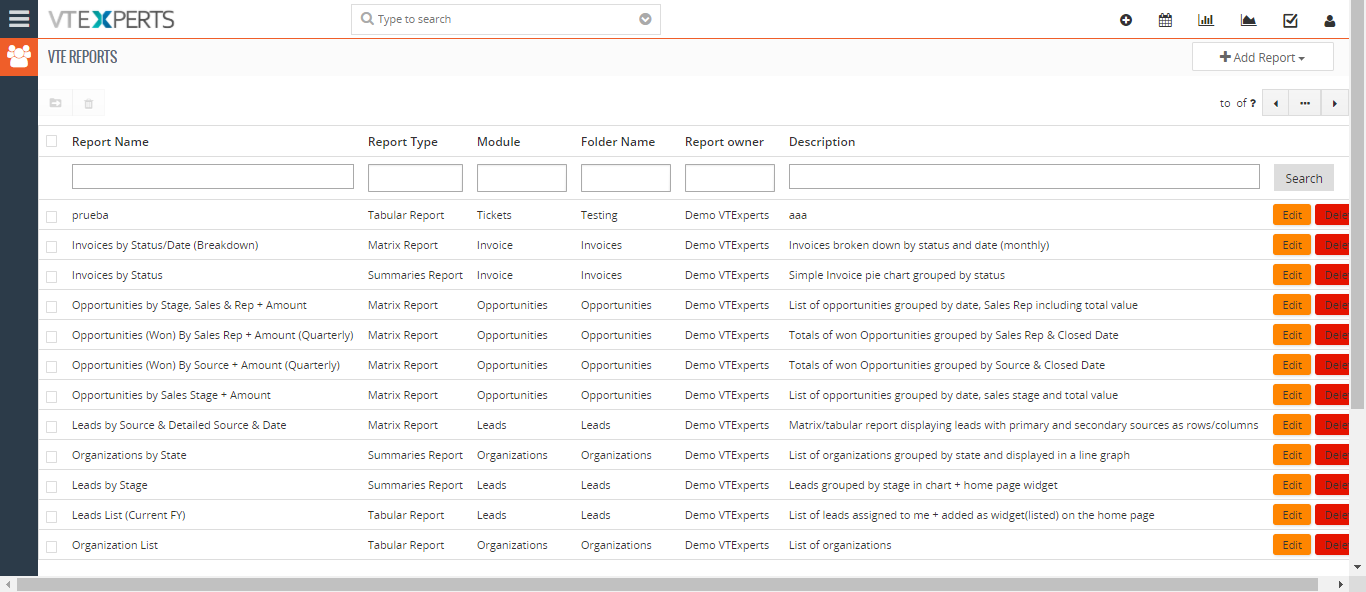
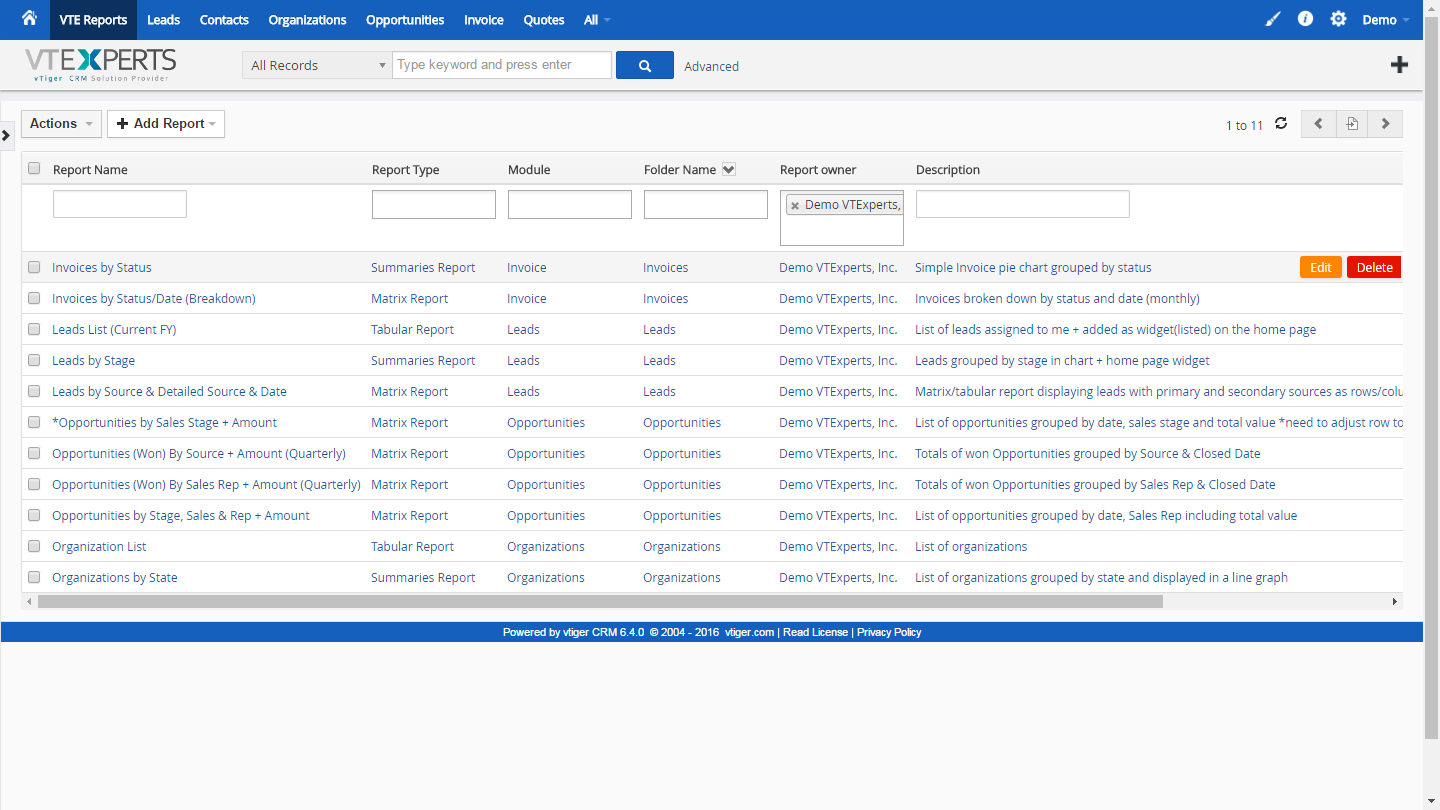
Reports List: list of all the reports created that can be sorted and found on the basis of Report name, type, module, owner and more.
Add Report
It allows to create 3 types of reports:
Tabular Report – for xxx
Summaries Report – for xxx
Matrix Report – for xxx
Tabular Report
It consists of 7 blocks:
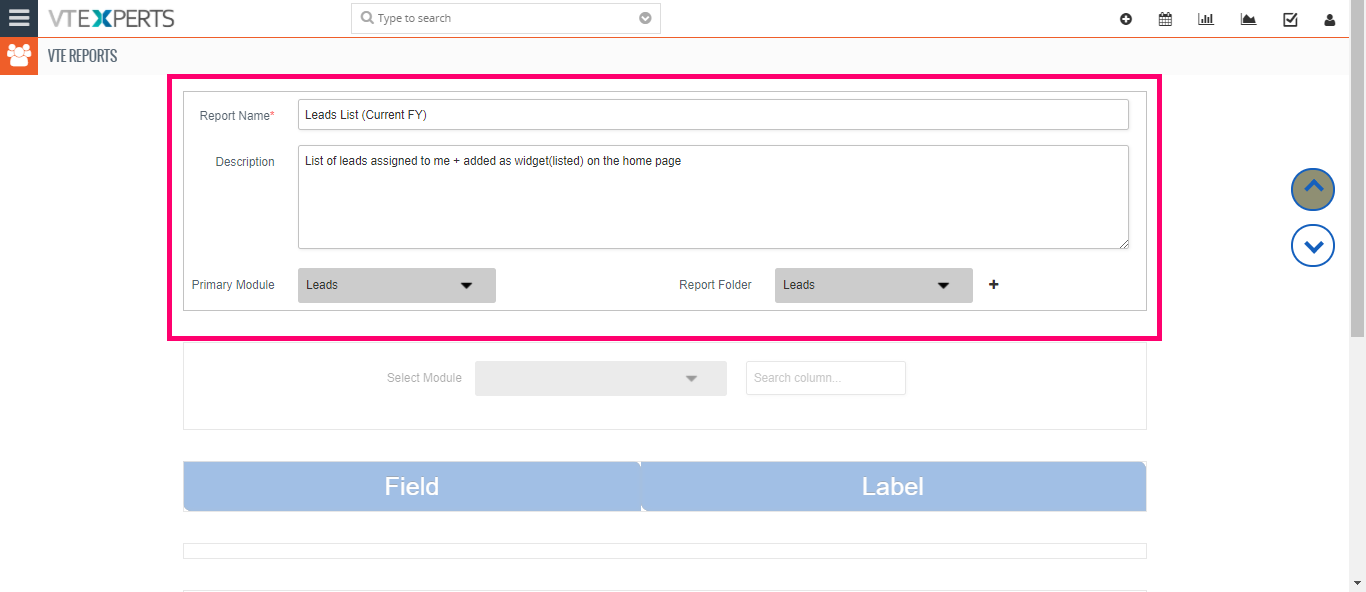
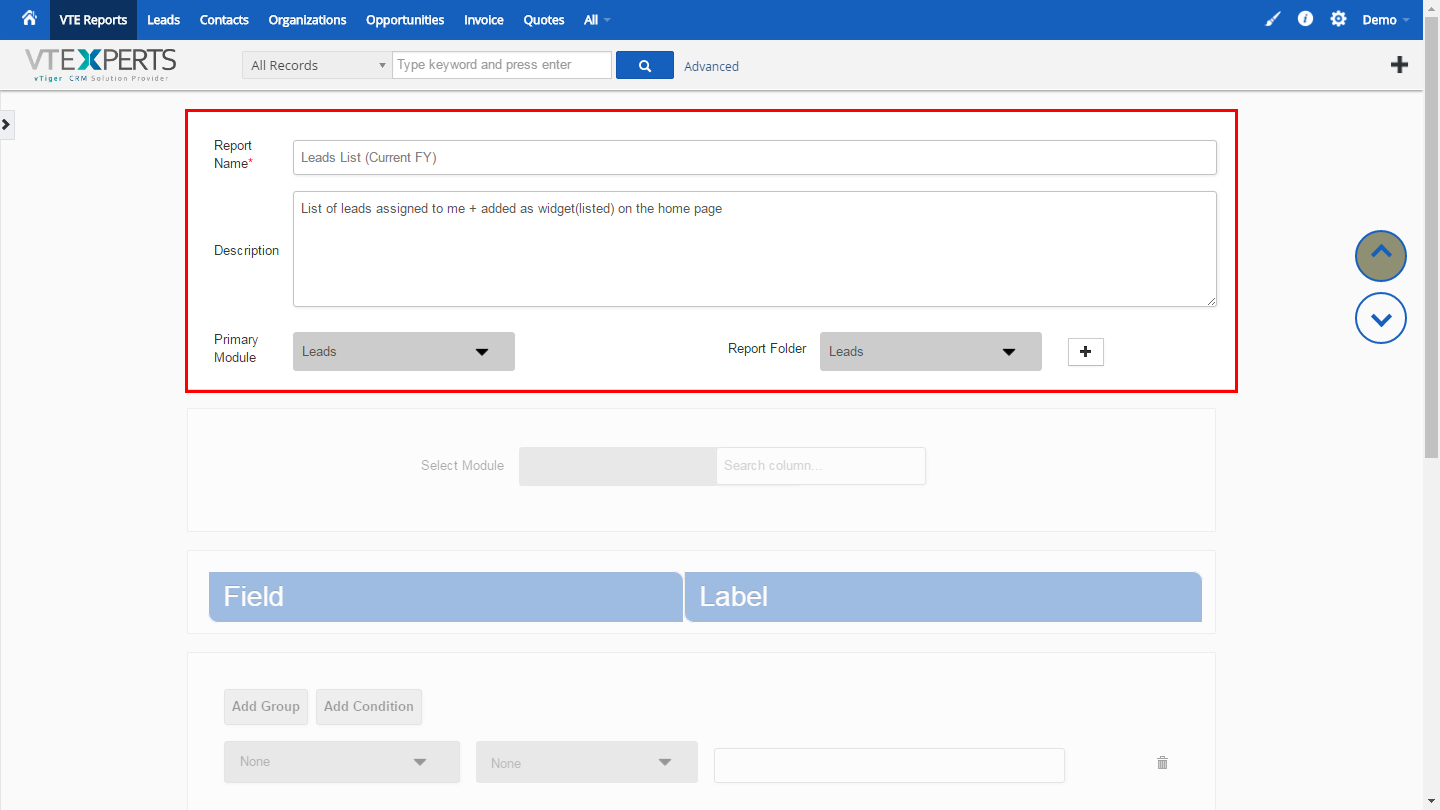
1. General Information
Report Name: simply the name of the Report
Description: the quick information about the Report
Primary Module: the module about which the report is
Report Folder: create a folder to sort the reports according to their categories/working
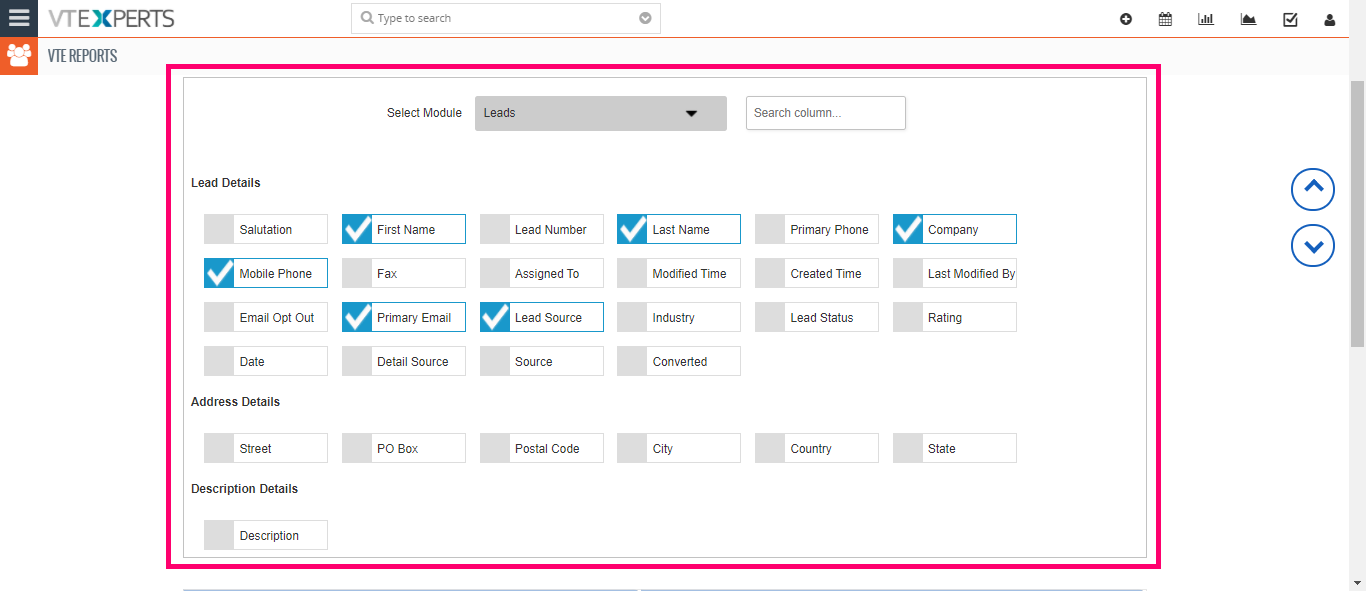
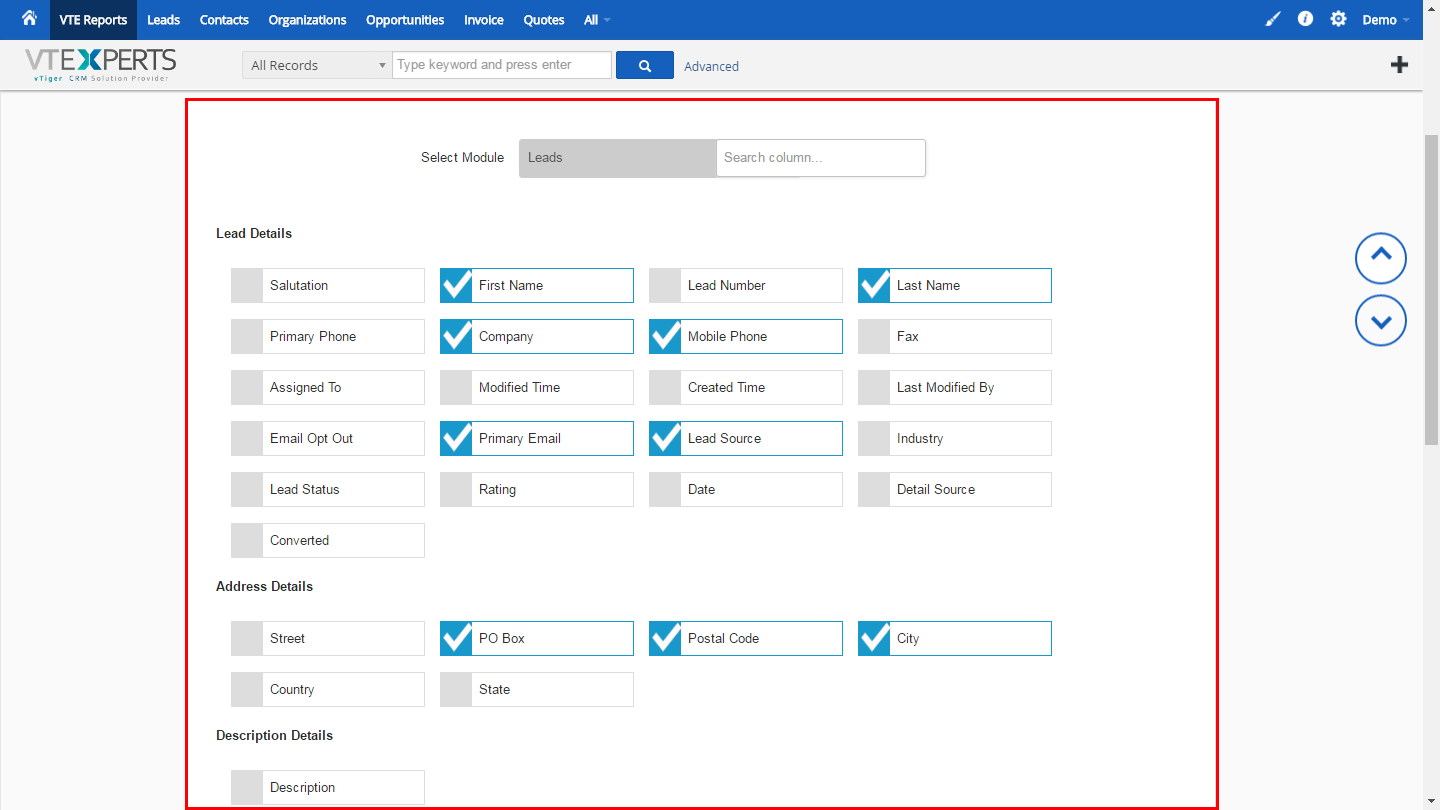
2. Field Selection
Allows you to select fields to be included in the Report.
Select Module: drop-down to select from multiple modules that are linked to the primary modules. Simply check the field boxes and the selected fields will be included in the report.
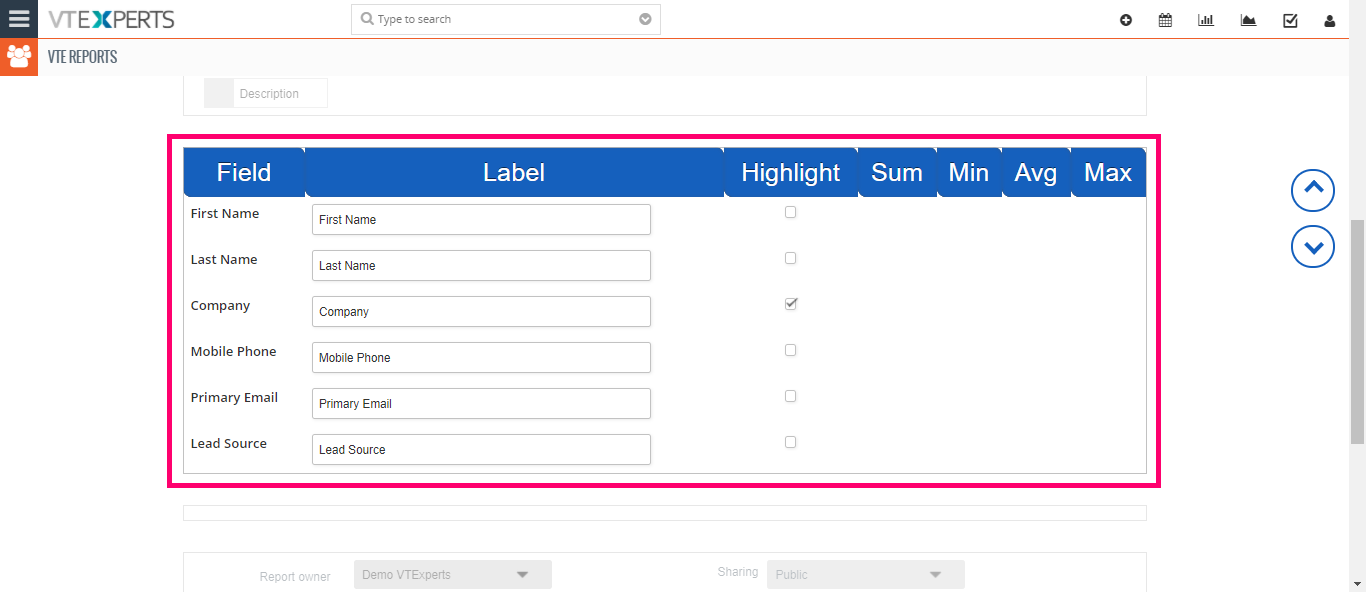
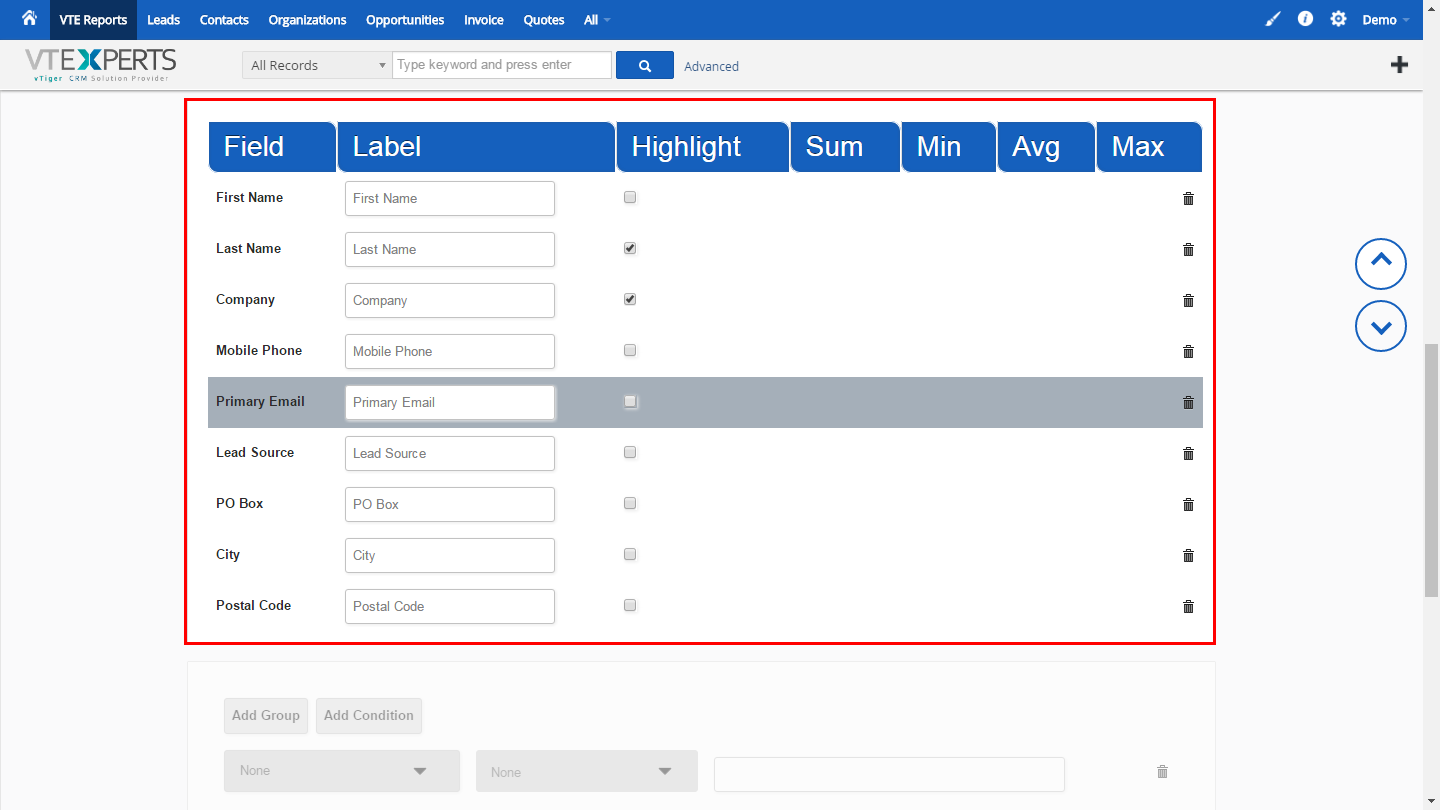
3. Labels
It controls what shows up on the report.
Field: name of the field to be customized
Label: the custom label of the field
Highlight: check the box besides every field if you want to highlight the field
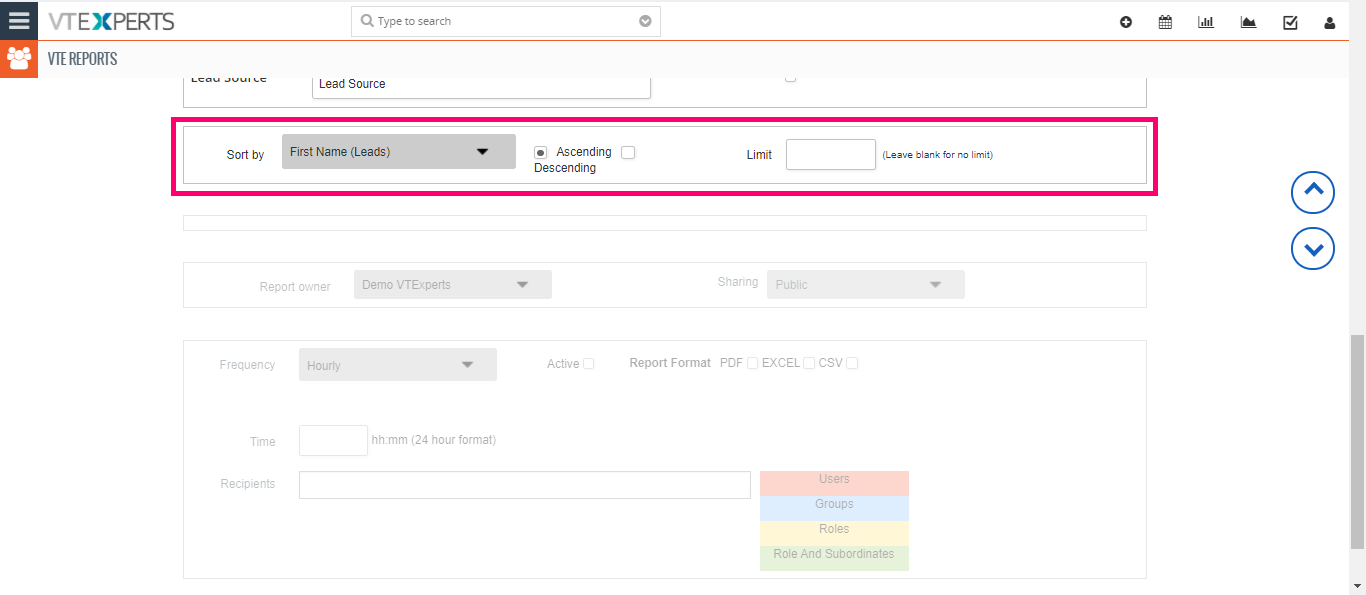
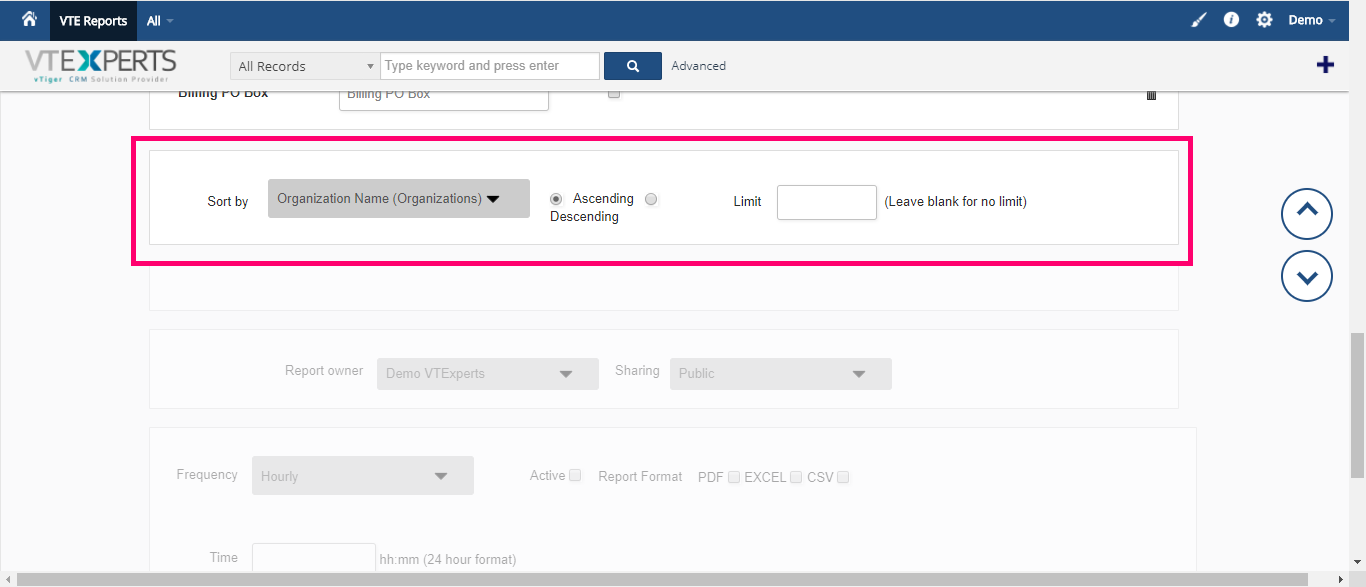
4. Sorting and Limiting
Sort by: allows you to sort by modules
Ascending/Descending: arrange the fields by their ascending or descending orders
Limit:
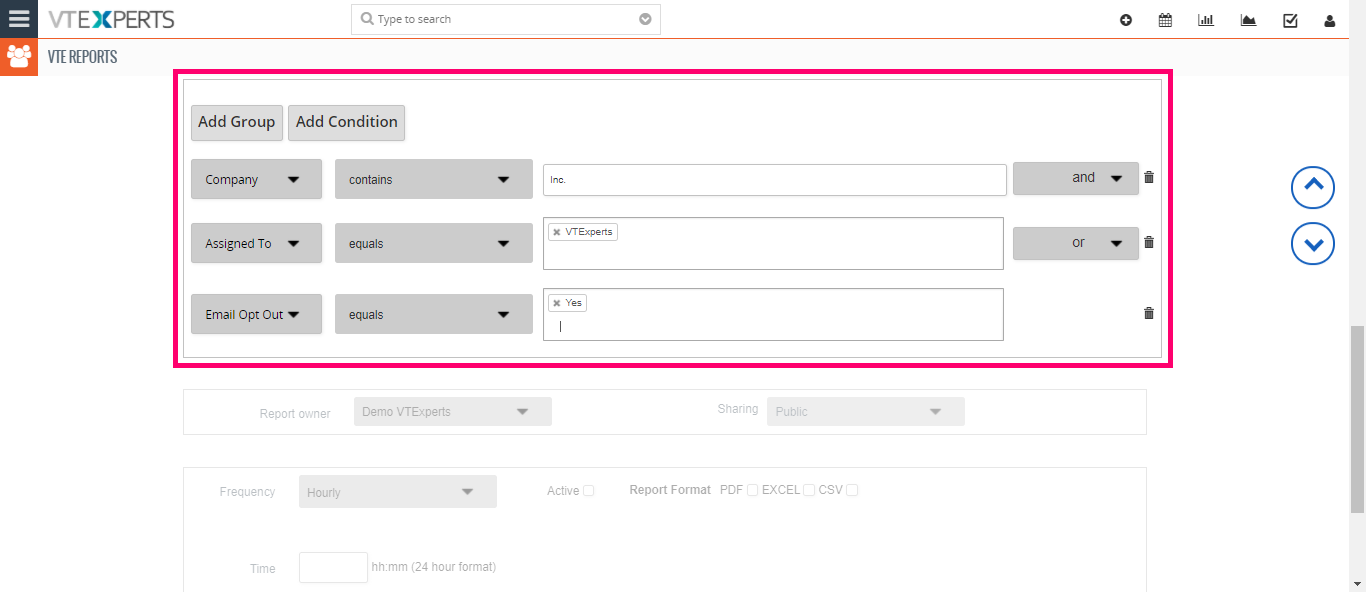
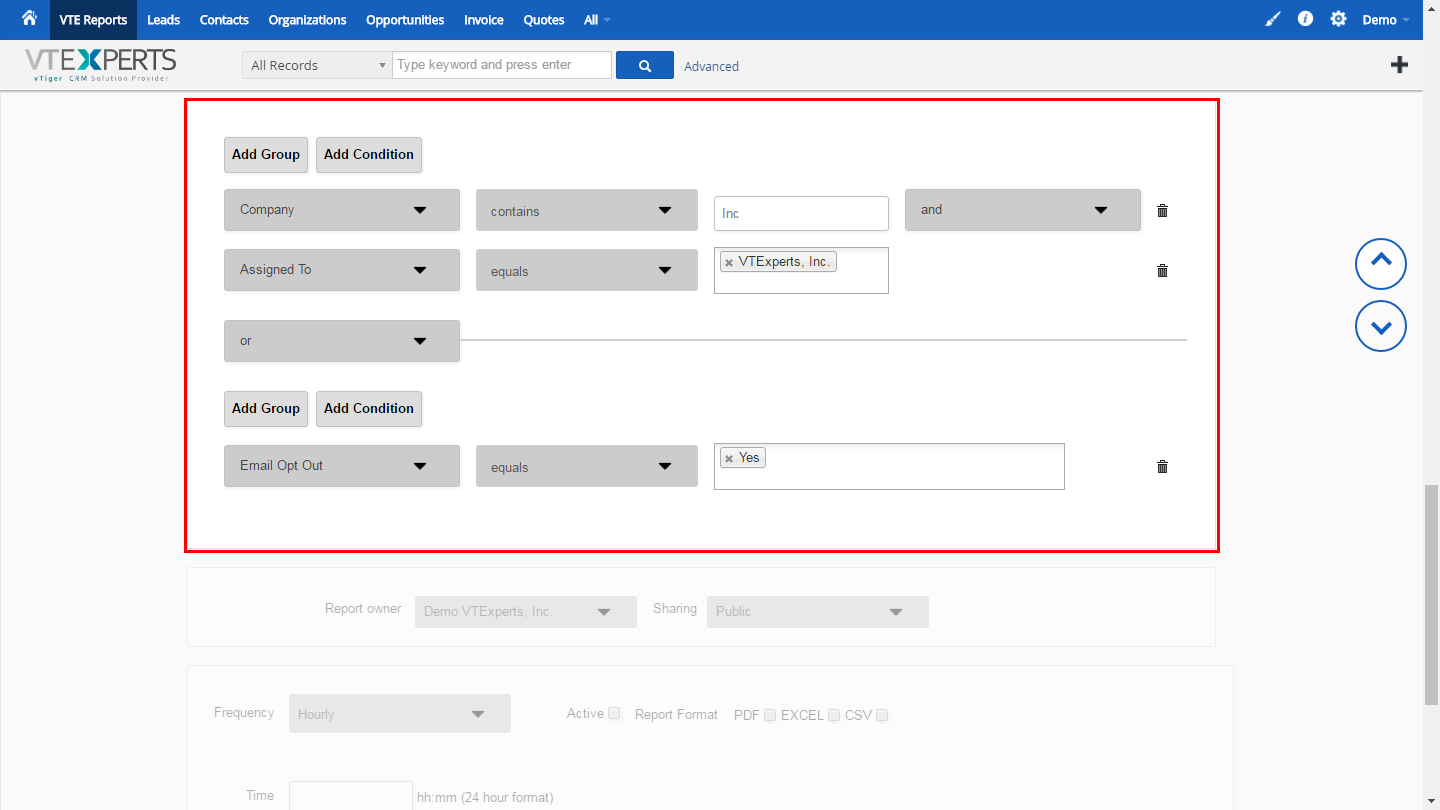
5. Filters
Creating new Filters.
Field name: select a primary field
Condition: choose on what condition it should be triggered
Keywords: the blank field where you put the keywords for the filter to be run
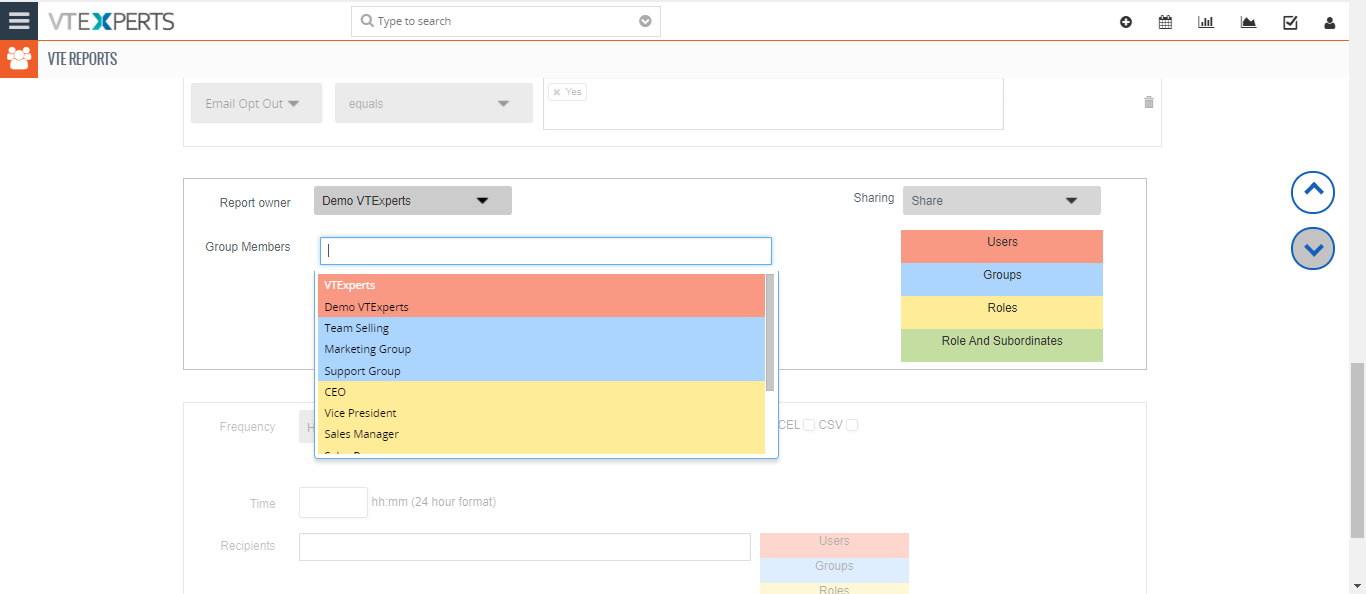
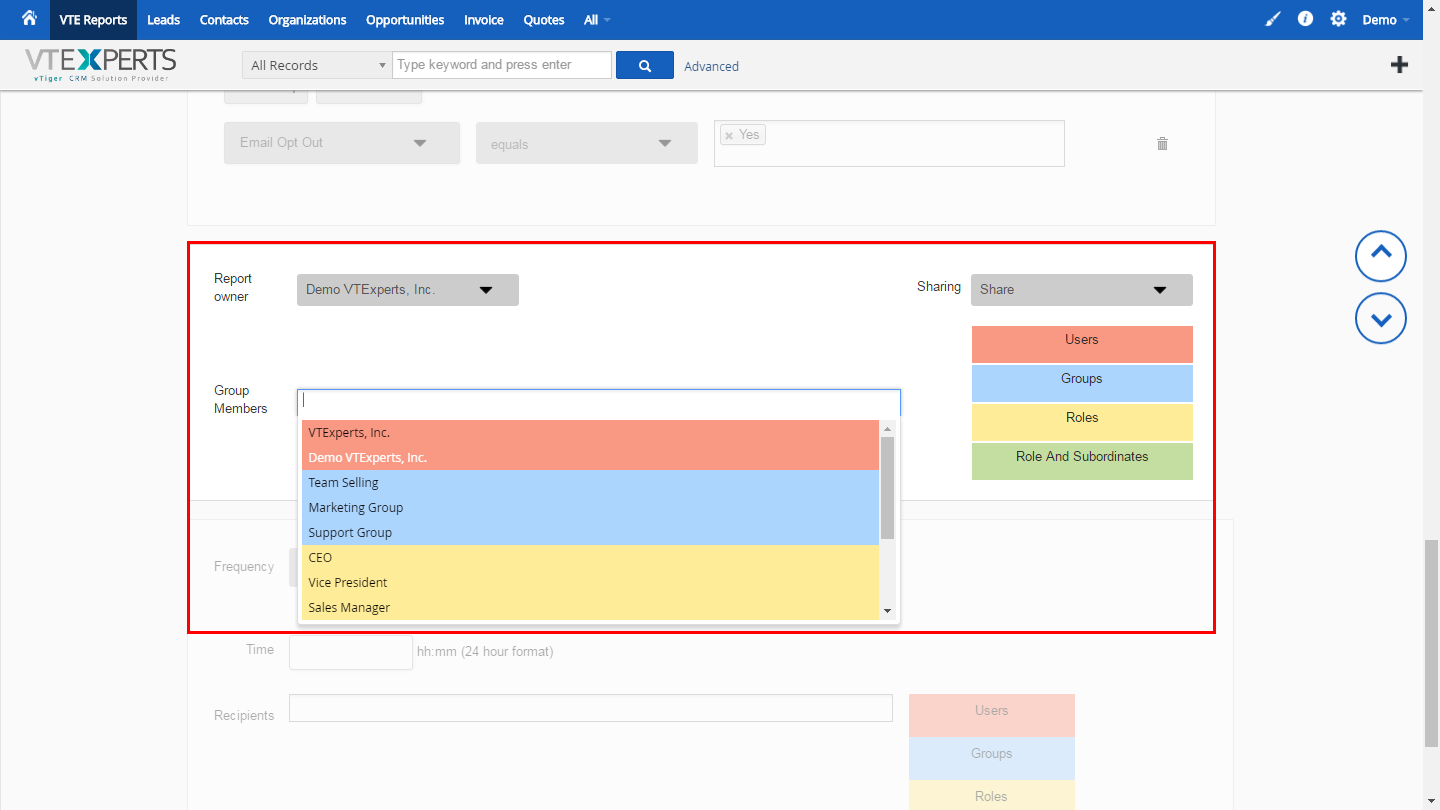
6. Report Owner and Sharing
Report Owner: select the owner/admin of the report
Sharing: configure the visibility of the report.
Public – anyone can see the report
Private – only admin can see the report
Share – share with selected users, groups, roles, or role and subordinates. Selecting this option will display another picklist where you will be able to assign the sharing rights.
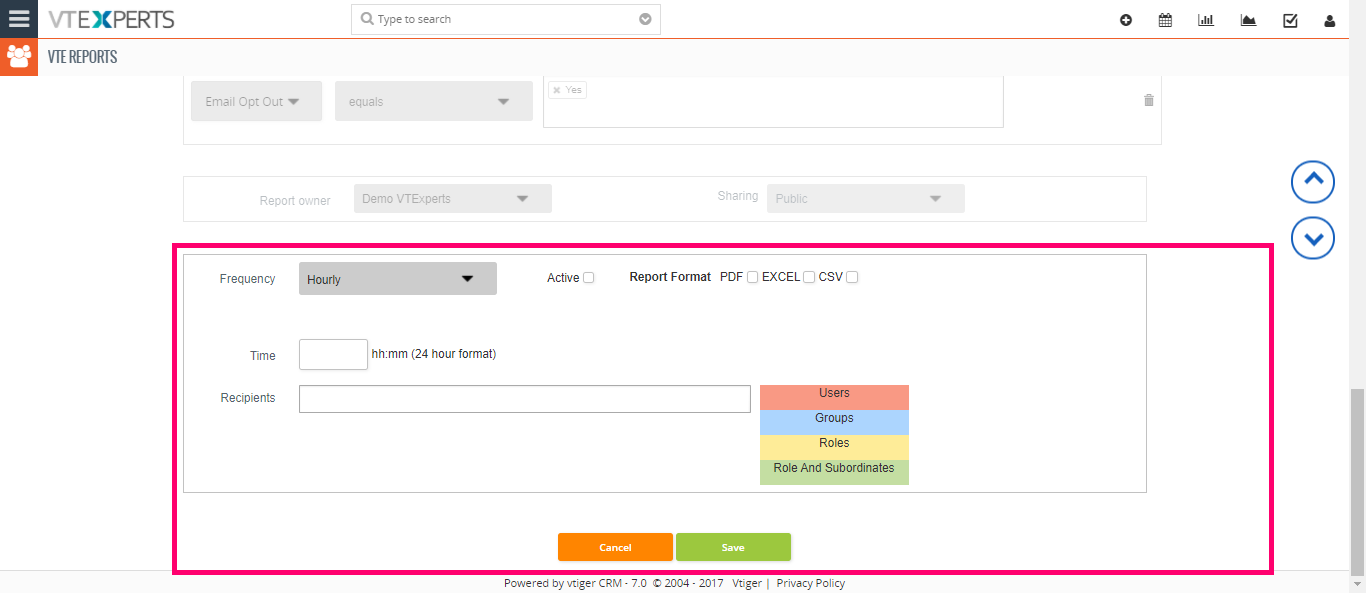
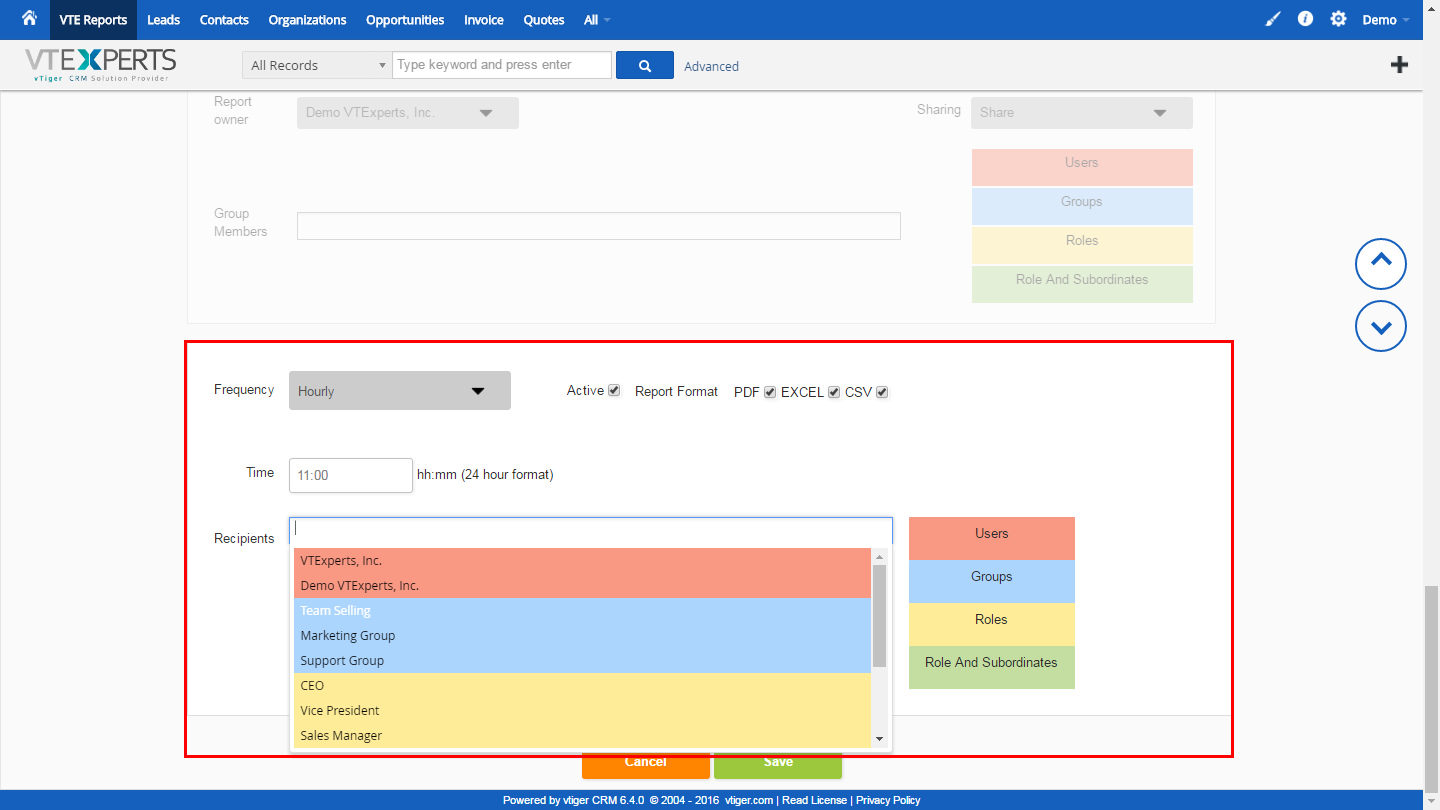
7. Schedule
Configure the report’s schedule when you want it to be sent out and whom it will be sent to.
Frequency: set up when and how often you want the reports to go out
Active: select this box to make the schedule working
Report format: choose the format of the report in which you want the report to be sent i.e. PDF, Excel, or CSV
Time: select the time of sending the report
Recipients: select the users to whom you want to send the scheduled reports.
Matrix Reports
It consists of 8 blocks:
1. General Information
Refer to Tabular Reports.
2. Field Select from Primary Modules
This section contains all the fields related to Invoices. For more info on the block, refer to Tabular Reports.
3. Label of Total
Change the label of total amount in this section.
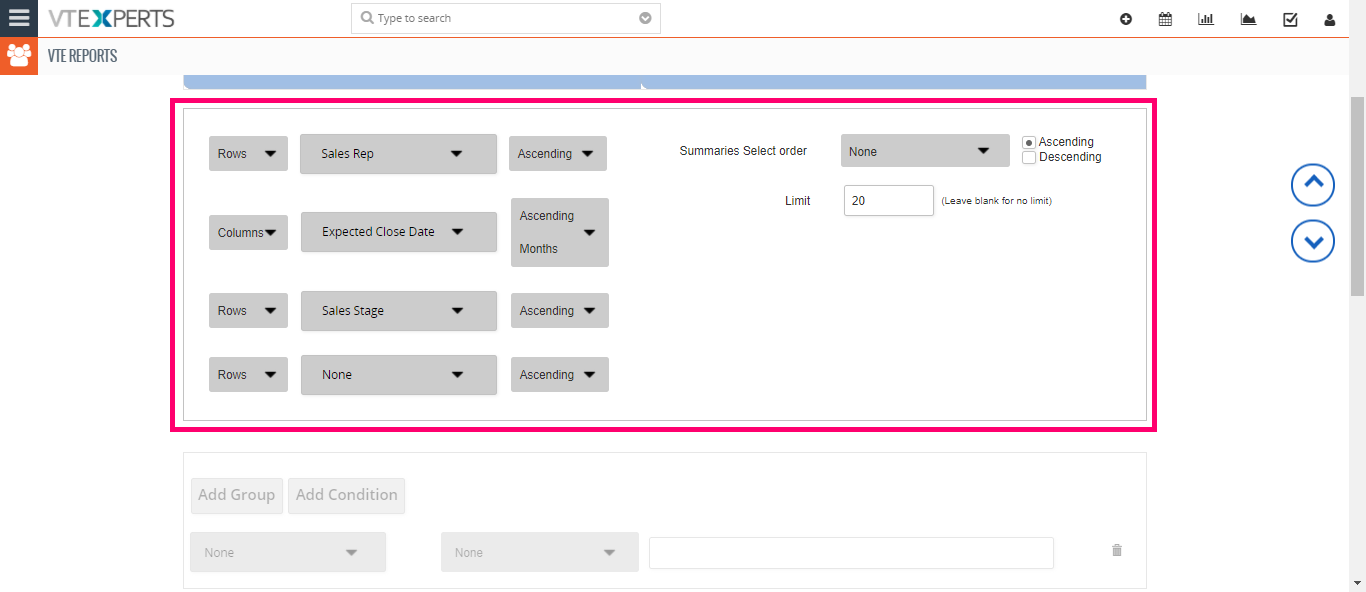
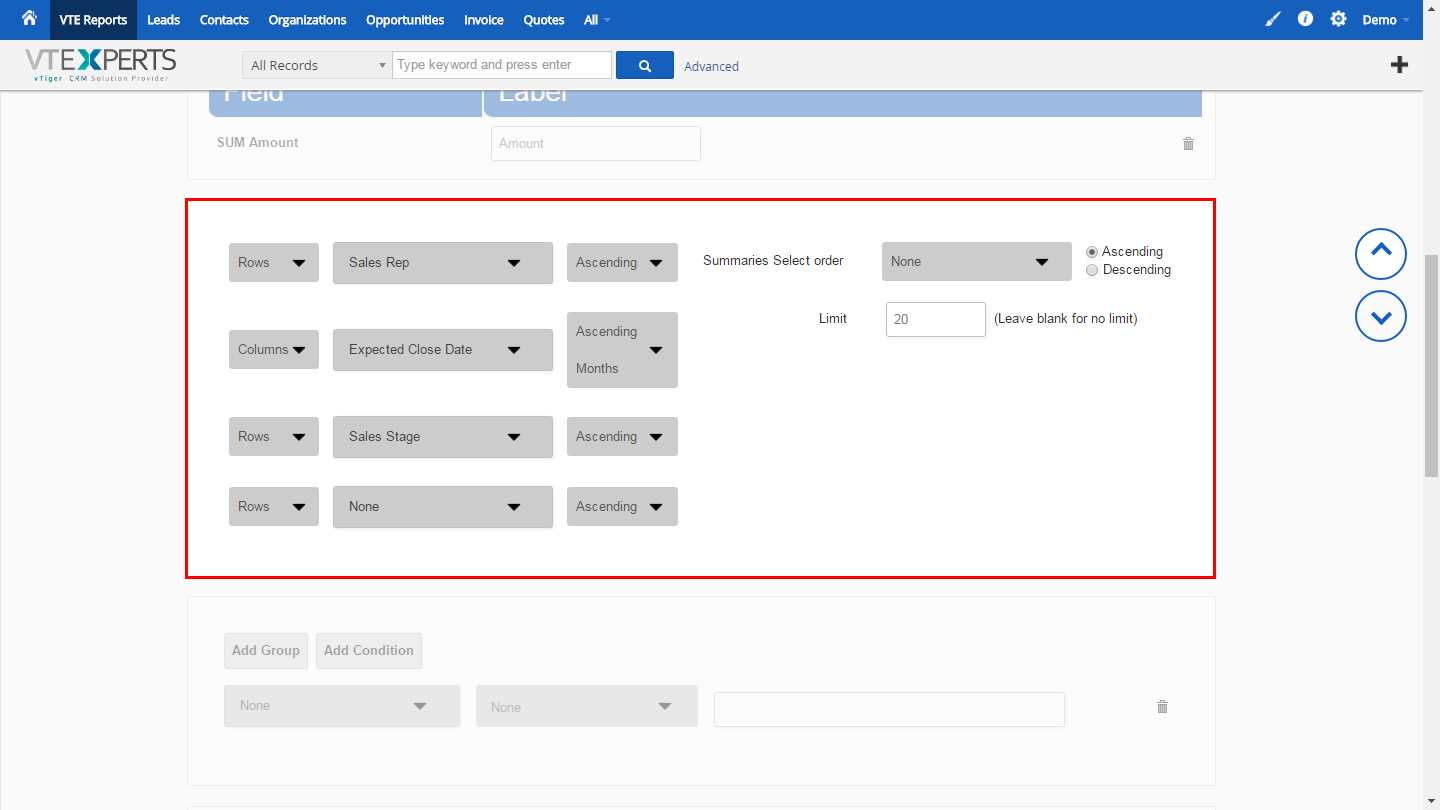
4. Creating Rows and Columns
This block allows you to add row, column, and then two more rows to the matrix report. Your results will be displayed as you configured.
1st dropdown menu: its set to either ‘Rows’ or ‘Columns’ and cannot be changed.
2nd dropdown menu: select the appropriate option from the menu according to your requirements and what you want to see in the rows or column.
3rd dropdown menu: choose the order in which the information will be displayed (ascending or descending).
Summaries Select Order: the order of the summaries of the report.
5. Summaries Filters
The standard filter functionality to filter out certain report statuses, invoices etc.
1st dropdown menu: select any invoice detail to be filtered out
2nd dropdown menu: choose a condition on the basis of which the invoices will be filtered
Empty field: add the value that will be filtered out if matched
6. Report Owner and Sharing
Refer to Tabular Reports.
7. Schedule
Refer to Tabular Reports.
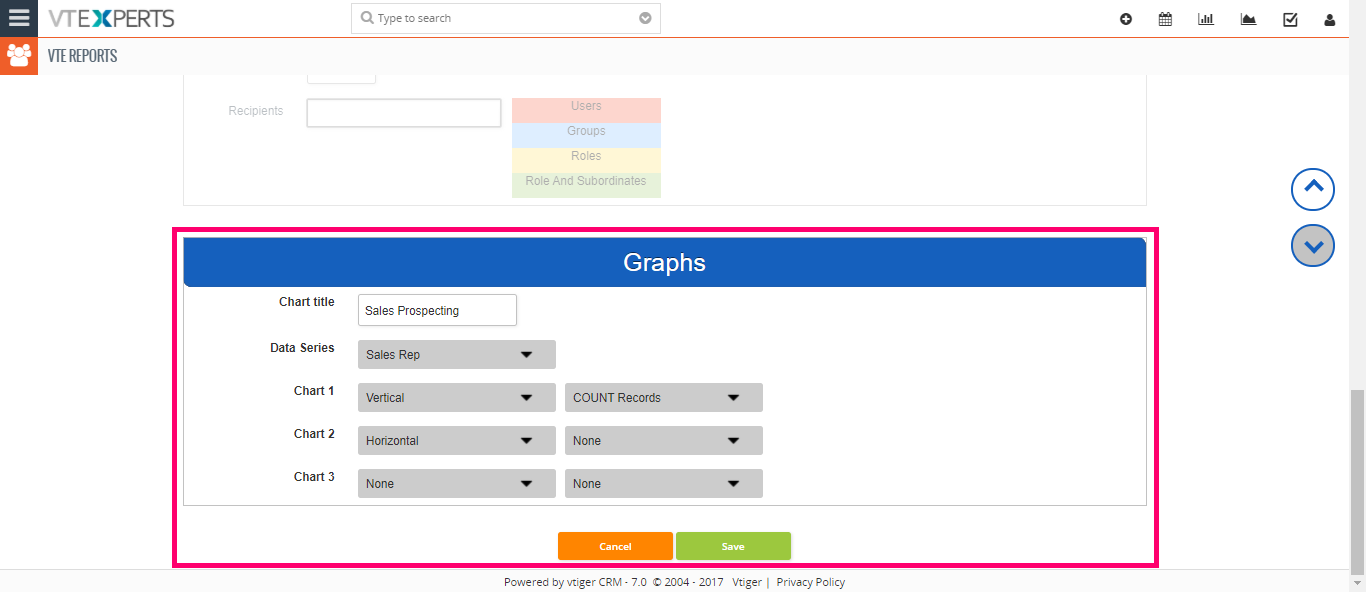
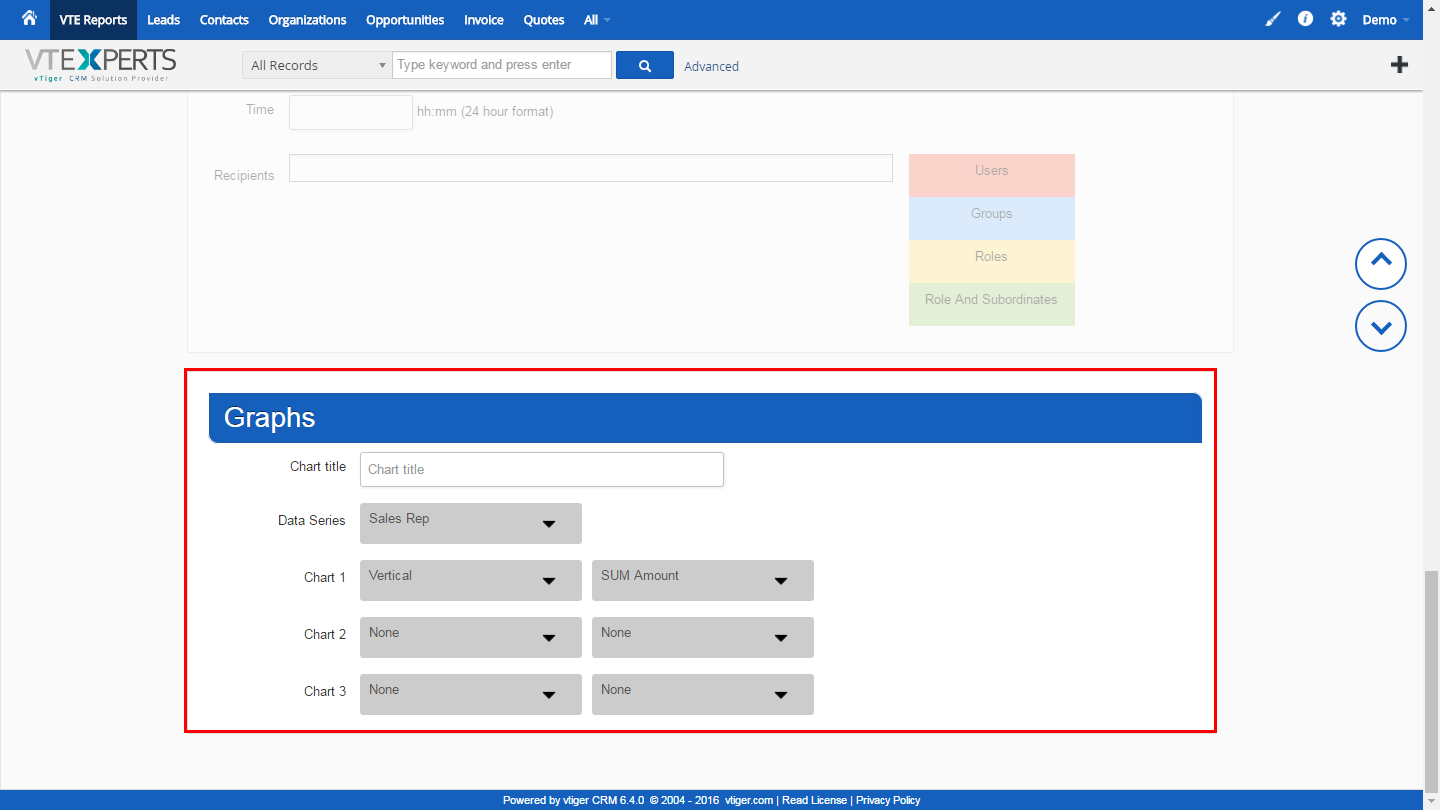
8. Graphs
Configure what kind of chart you want to display.
Chart title: the name of the chart
Data Series: select what kind of charts you want to display
Charts: select up to 3 charts, their views to display, and the content to be shown.
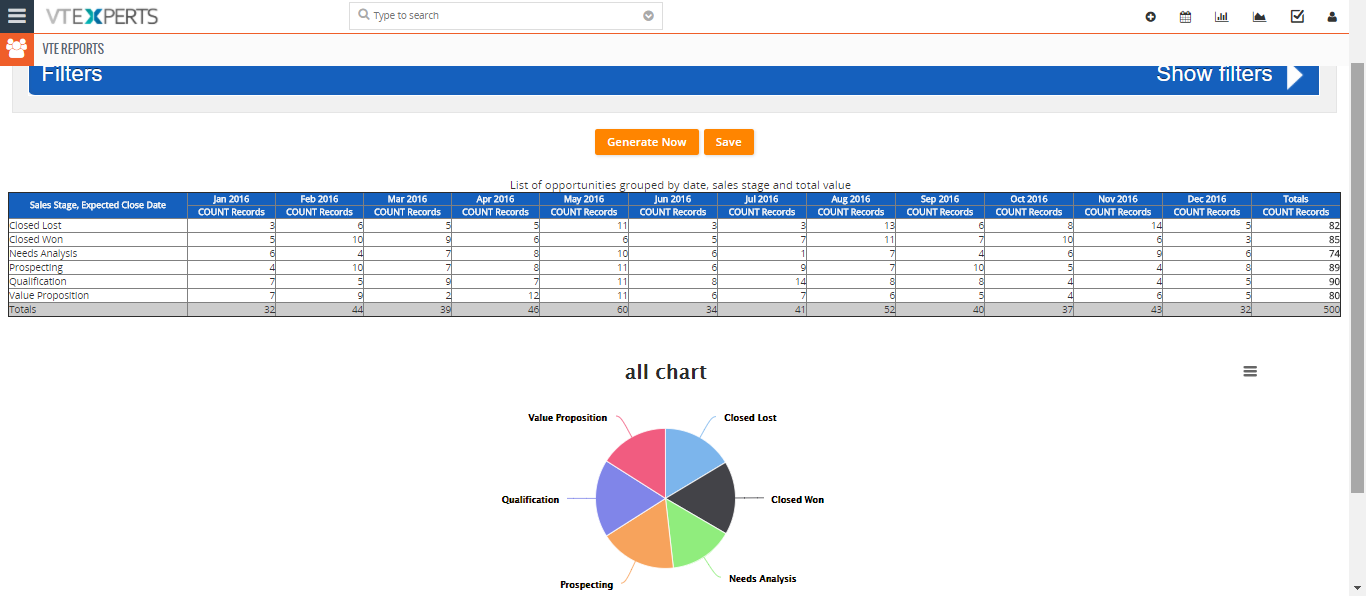
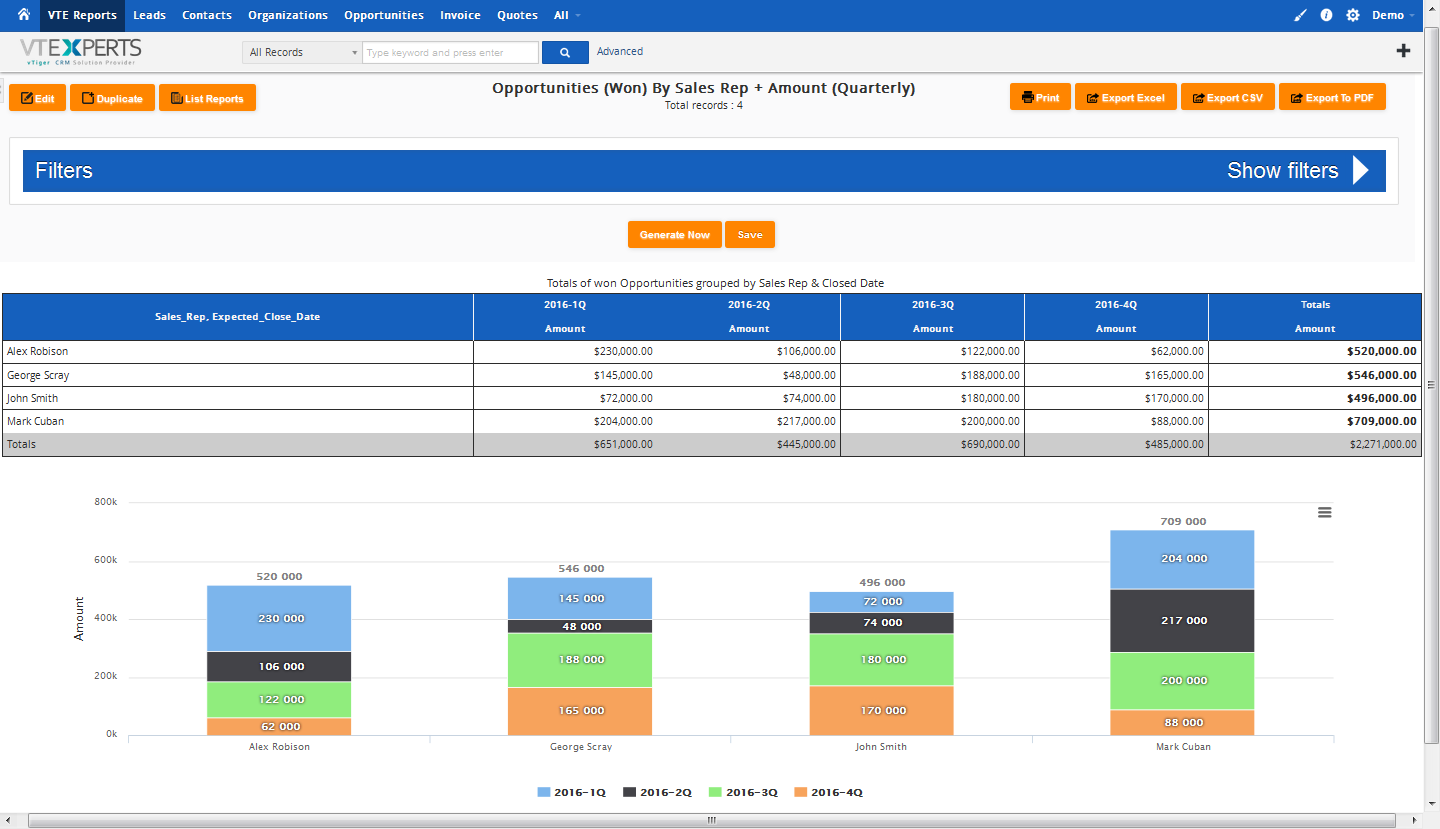
Reports Interface
Once you save the report, it will display all the detailed information in the arrangement that you chose. In case of Matrix report, the graph for the report will also be available under the report.
There are several sections in a Report’s interface:
Edit: to modify the report
Duplicate: to make copies of the report
List reports: go back to the list of the reports
Filters: click to expand / collapse the filters block. If needed, you can create a filter on the go
Report: the configured report with the selected fields are shown in the original report created as per the configuration.
Generate now: to run the system and generate a fresh report
Save: to save the report
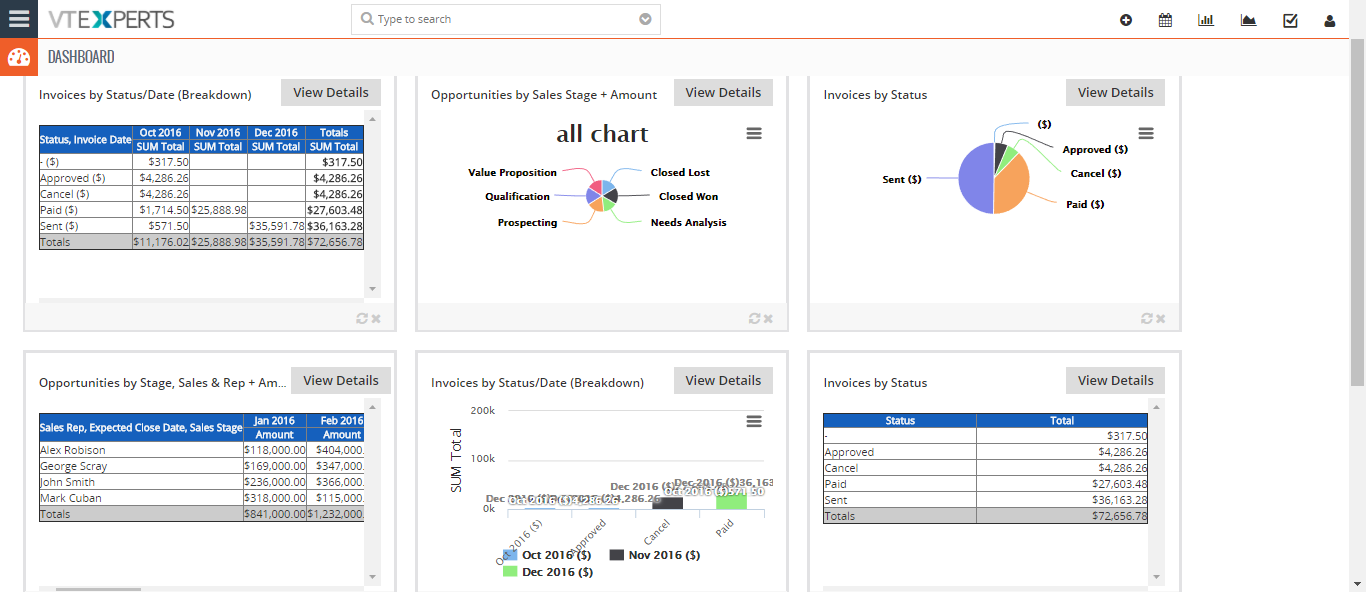
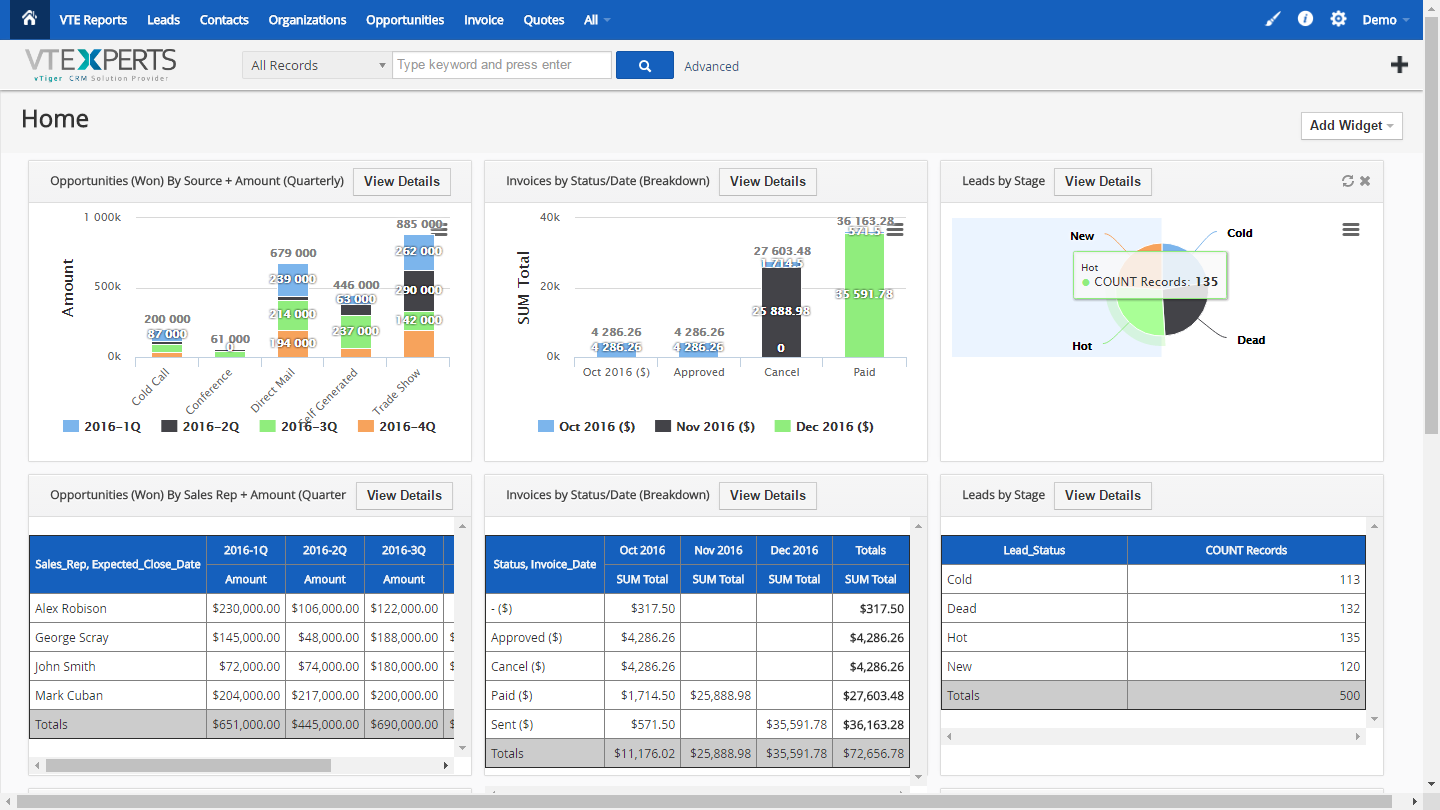
Add detail/widget to dashboard home page: to add the widget of the report to the dashboard at home page