
VTiger Forecast Extension was designed to help manage and predict Organization’s current and future Opportunities. It includes ability to view the entire company’s Opportunities as well as drill down to each Team or User.
Its intuitive configuration panel is carefully build to allow each Sales Stage to be categorized e.g. (Pipeline, Best Case, Committed, Closed, etc.) and Opportunity Type e.g. (New Business, Resale, etc.) for more accurate forecast. It also includes ability to specify Targets for each Team/User, and configure periods and personalized dashboards. Thus, you will be able to specify the dates such as range, months, quarters as well as number of periods to be displayed.
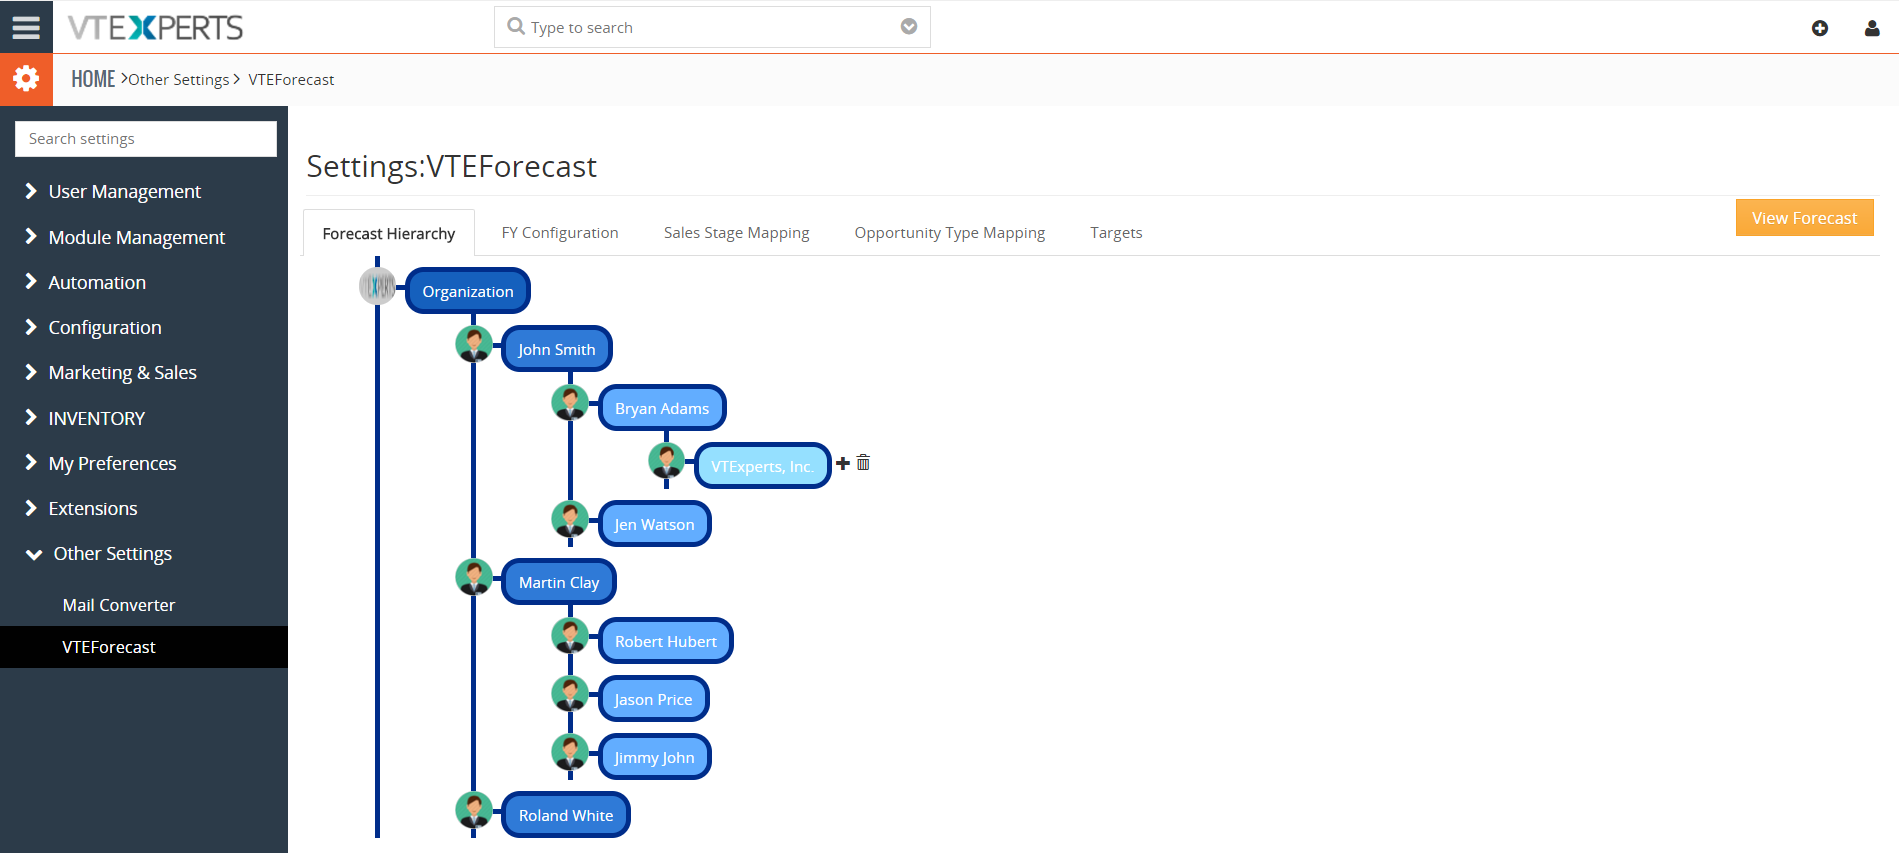
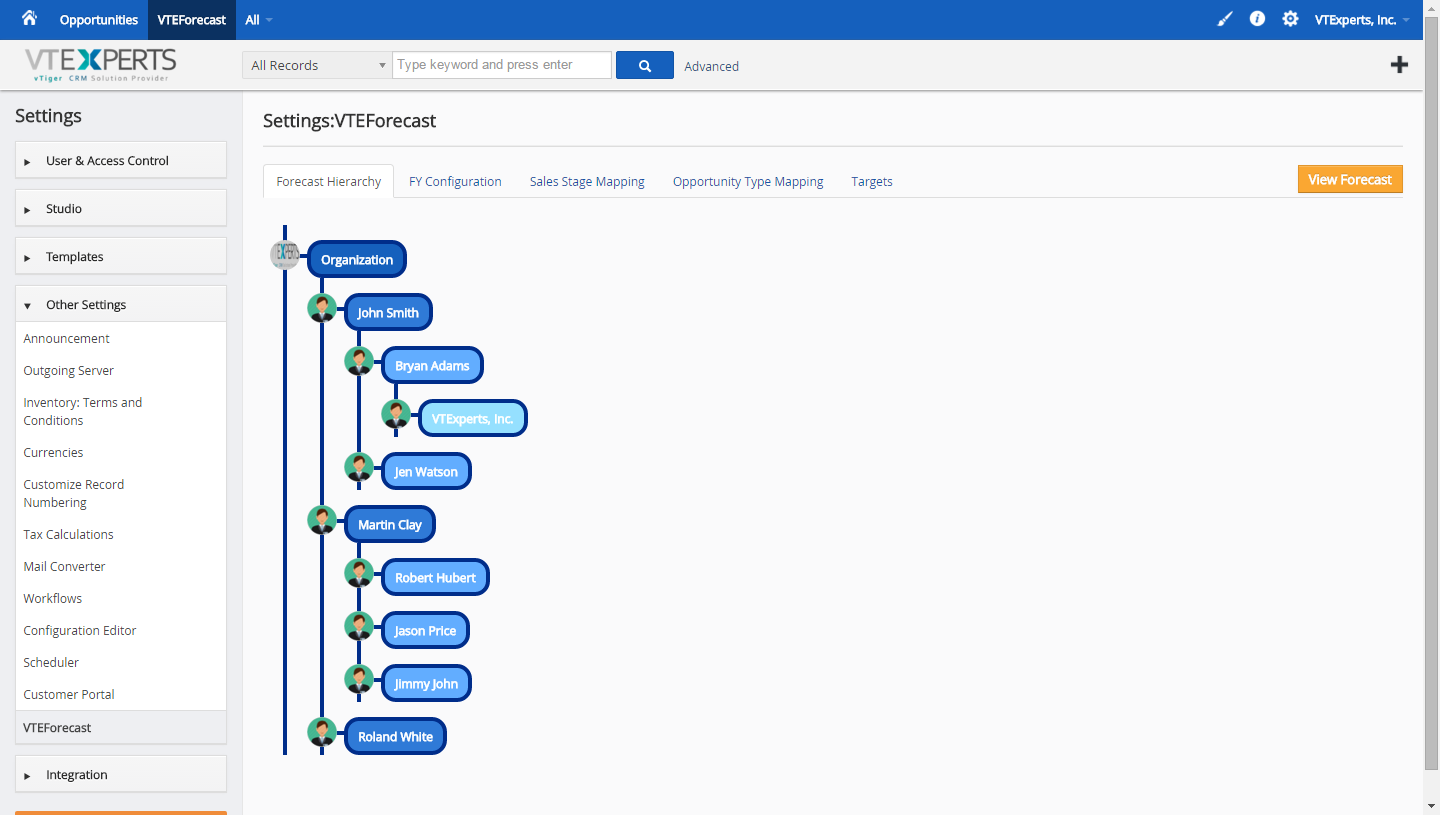
Forecast Hierarchy
Each user can be configured to have its own team/subordinates.
Administrator is shown at the top and have all users as subordinates
Vertical connection shows same level users to each other
Horizontal connection shows senior/manager and subordinate’s relation
Darker blue box means the user is more authorized
Lighter blue box means the user is less authorized
Add Subordinates button ( + ) which is shown by hovering pointer over a user allows to add users to his team
Delete button which is shown by hovering pointer over a user allows to remove the user from the team
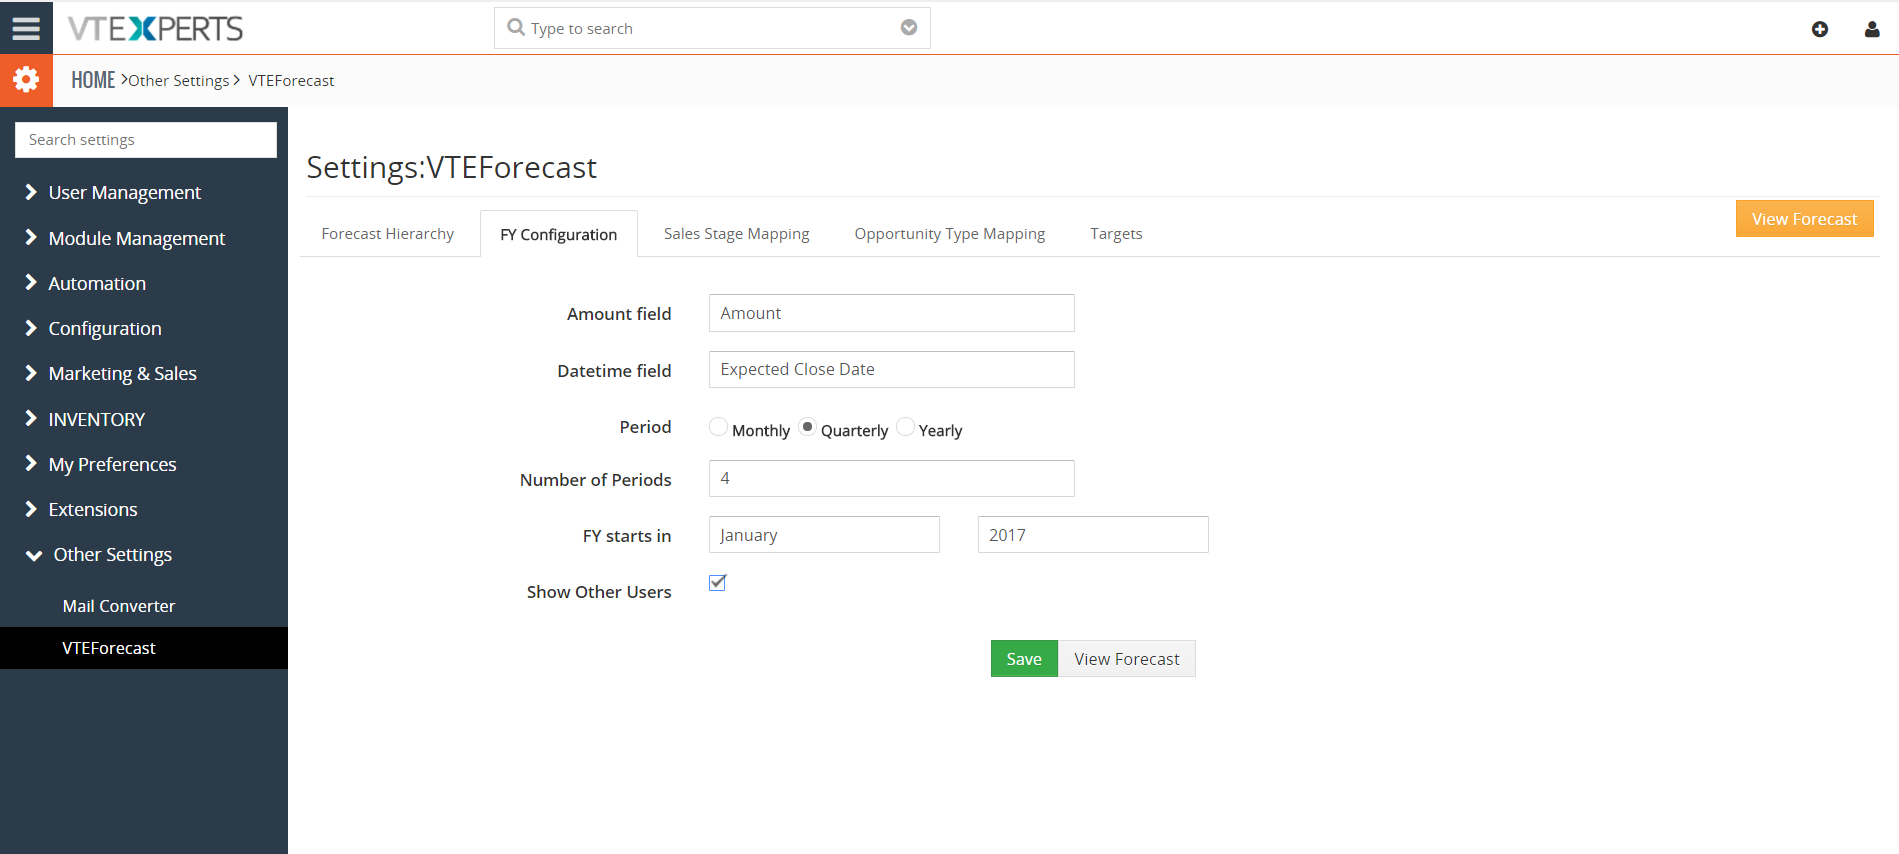
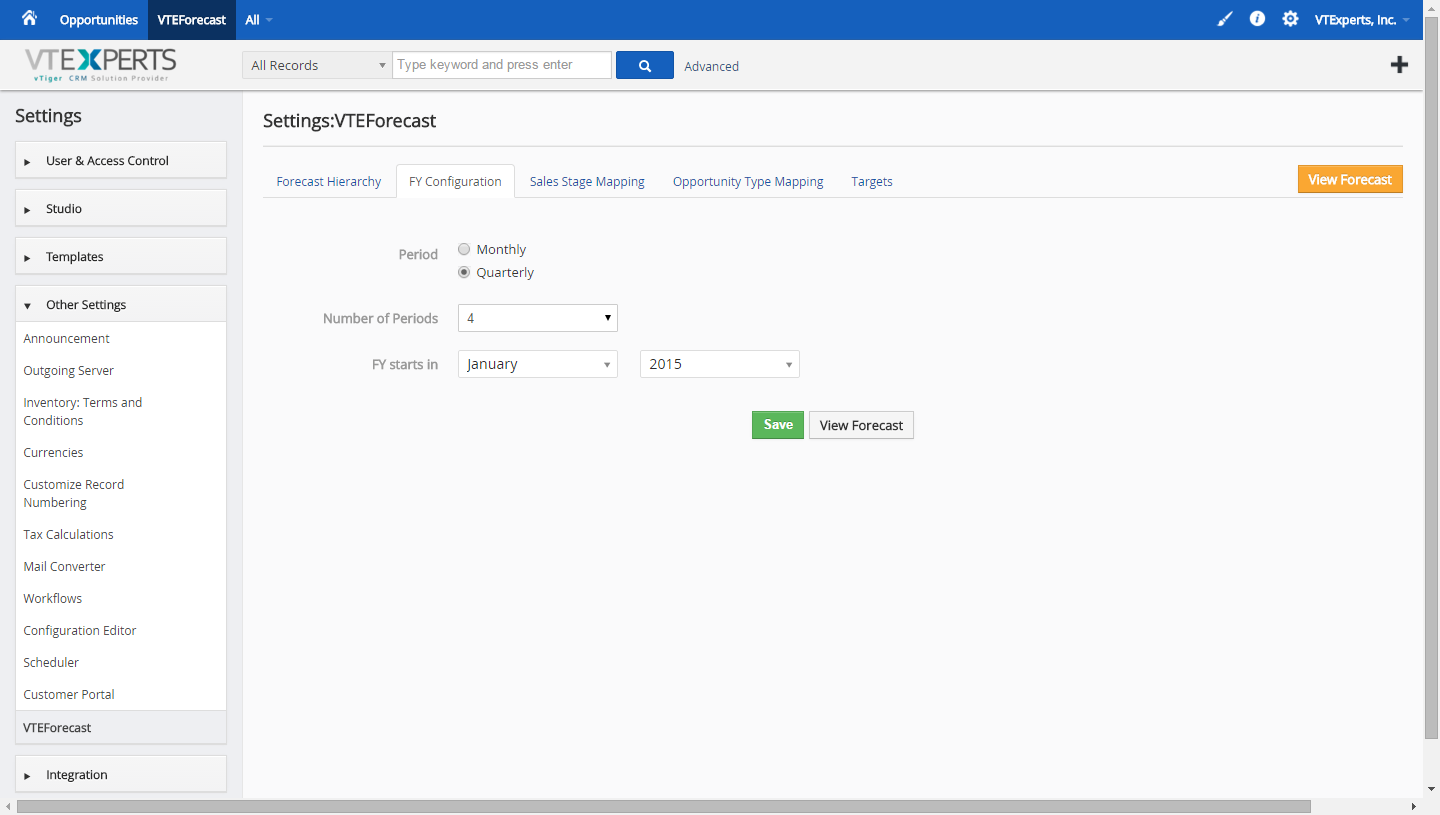
FY Configuration
It is also known as Financial Year Configuration:
Period: select the period from either monthly or quarterly
Number of Periods: specify the number of periods in your financial year
FY Starts in: date of the beginning of the financial year
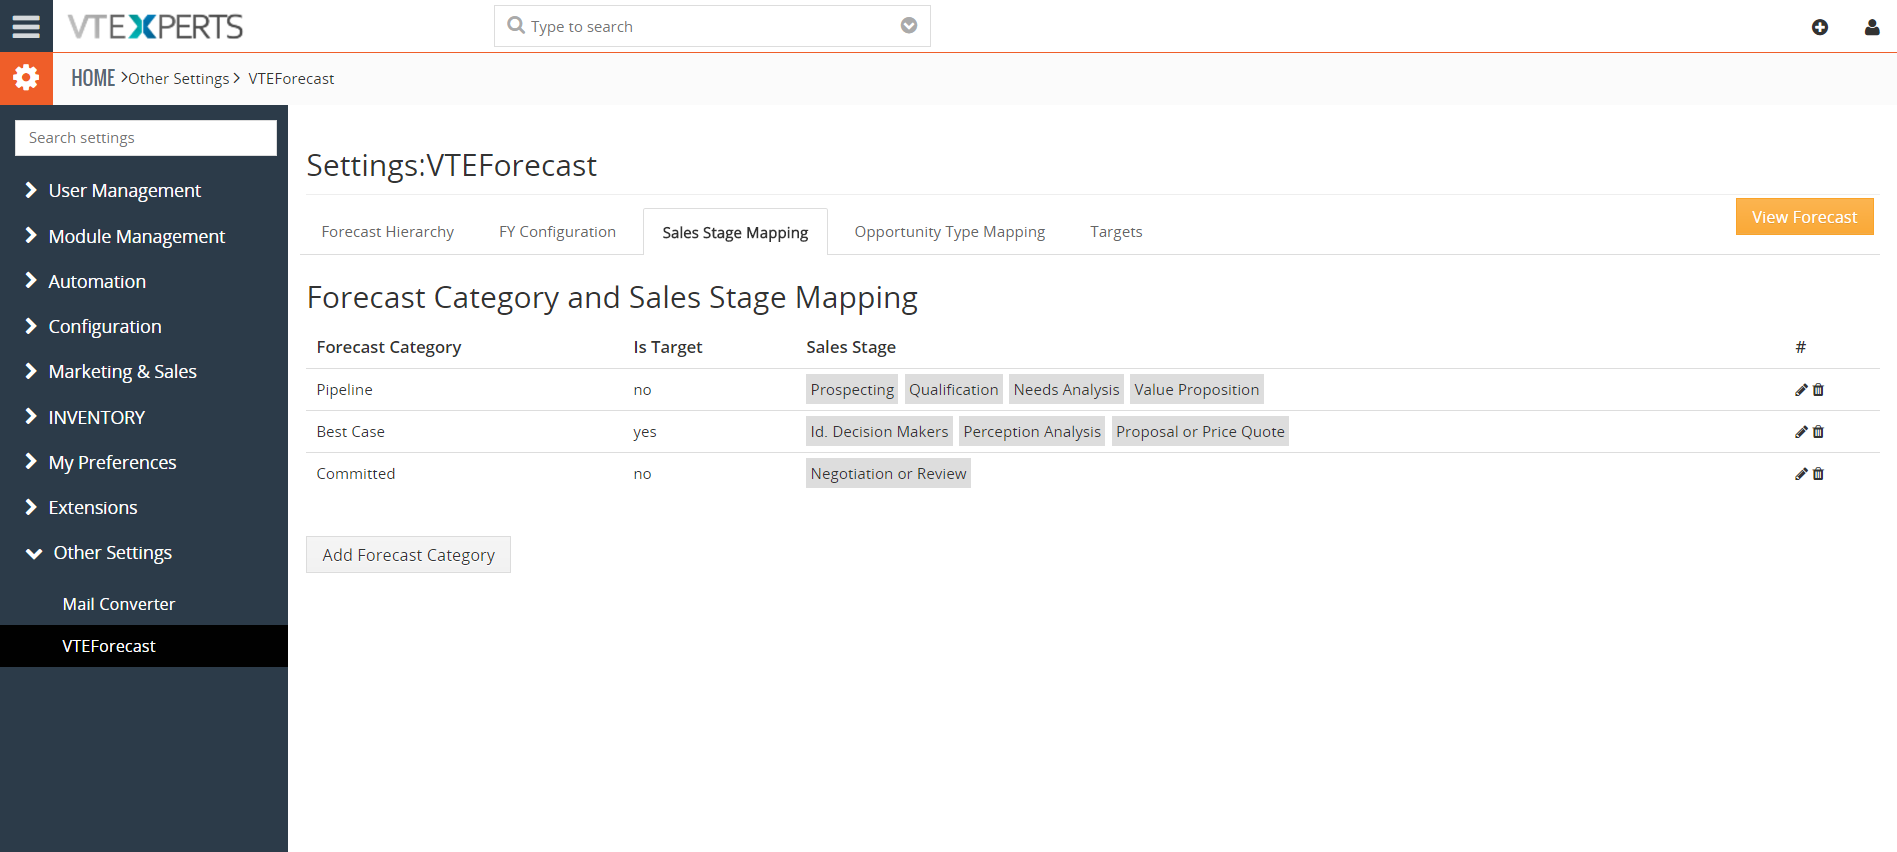
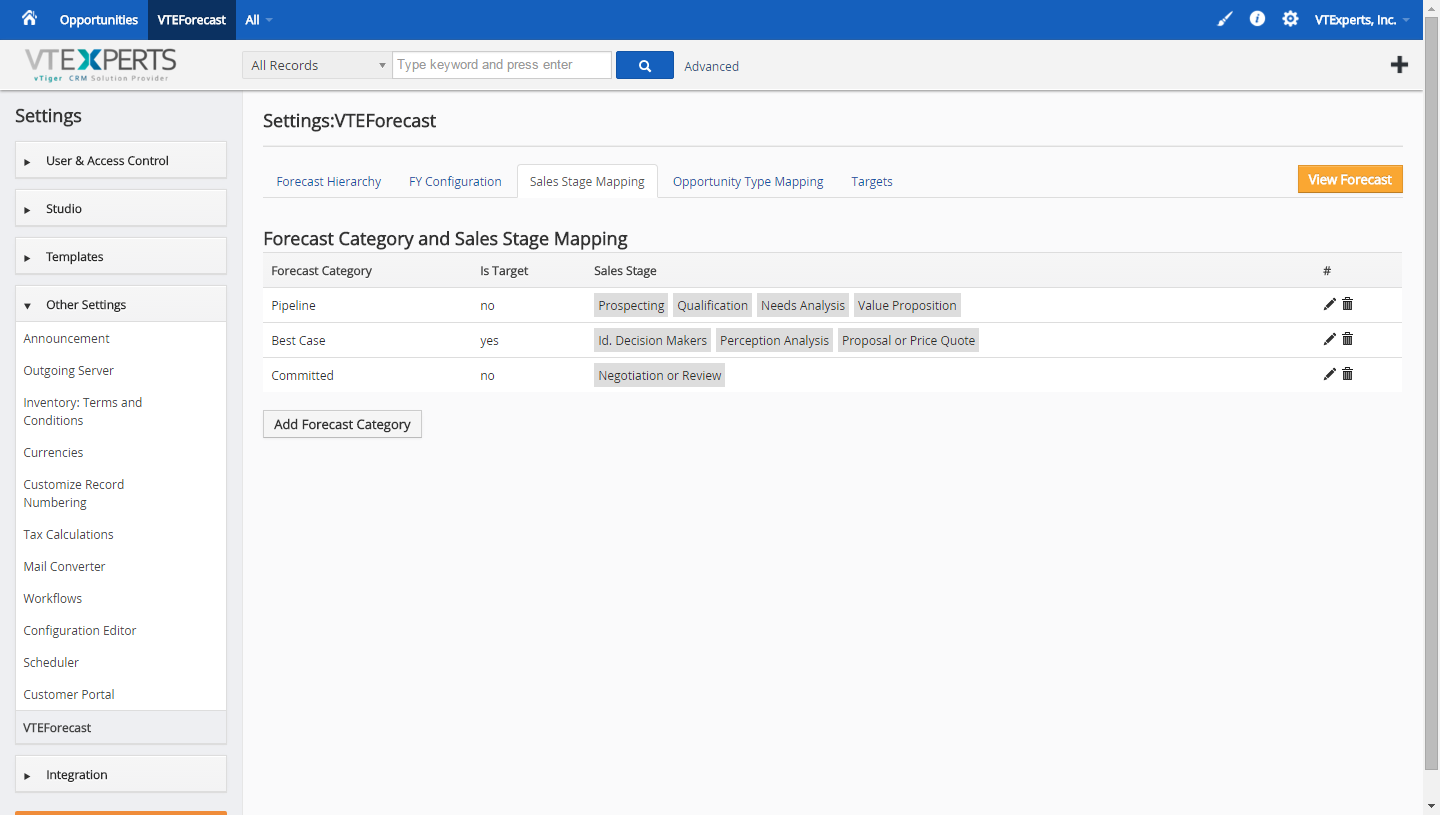
Sales Stage Mapping
Allows you to categorize each opportunity’s stage into more general category for reporting purposes.
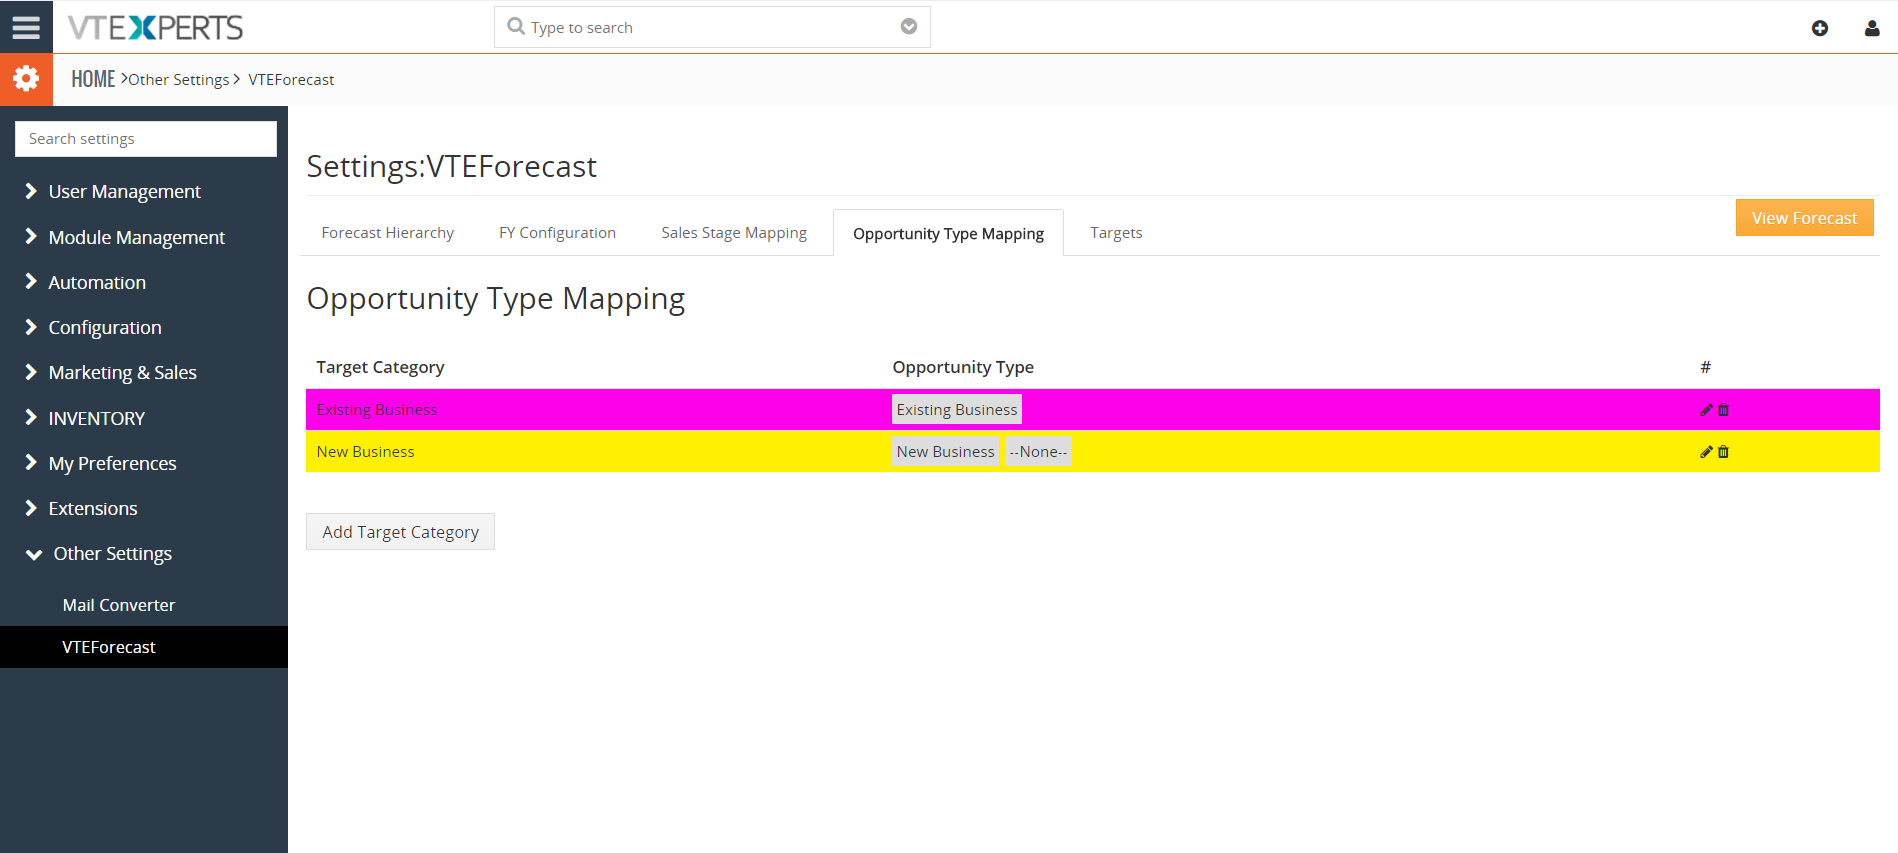
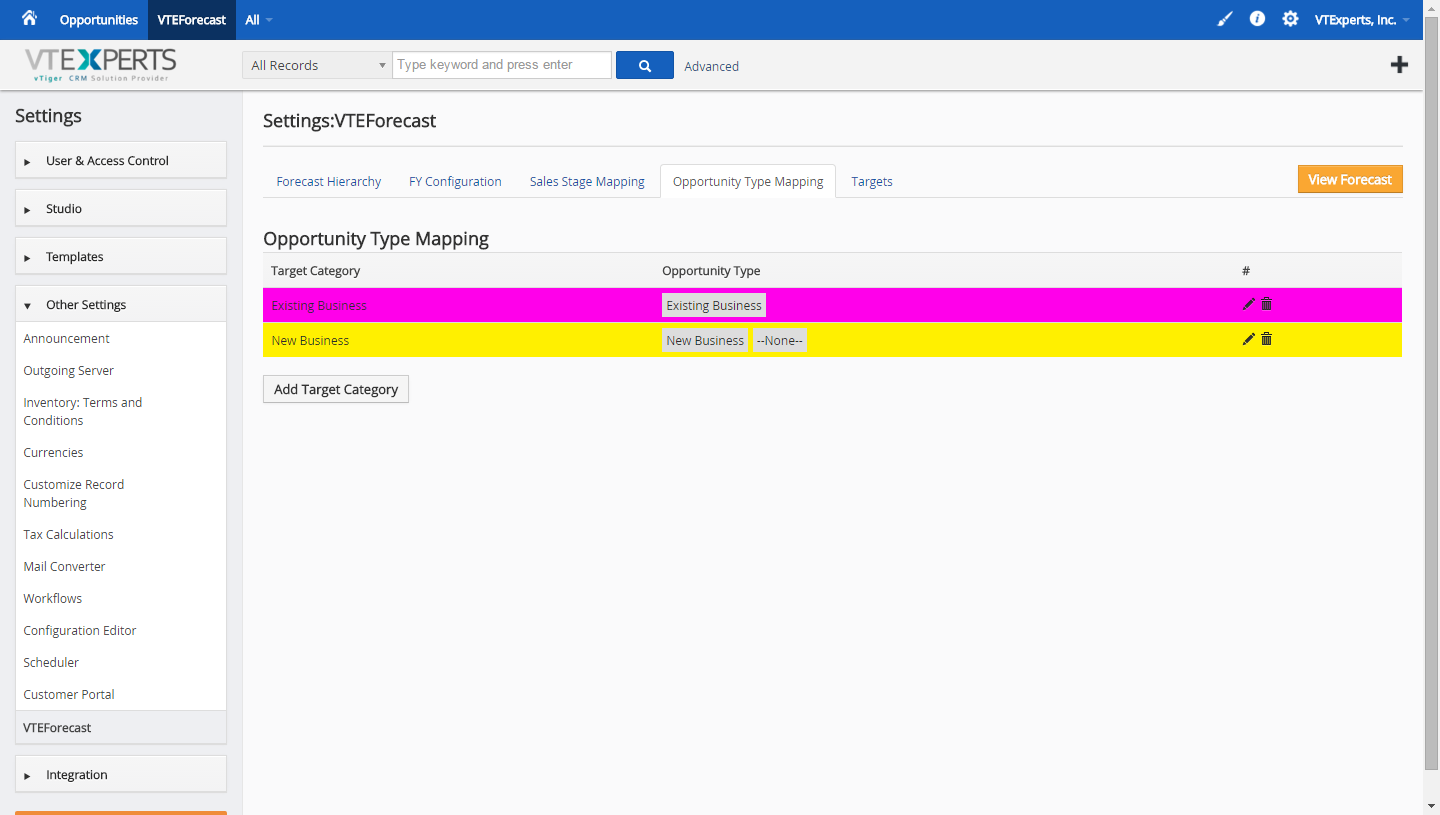
Opportunity Type Mapping
Similar to sales stage mapping, allows you to categorize each opportunity by type.
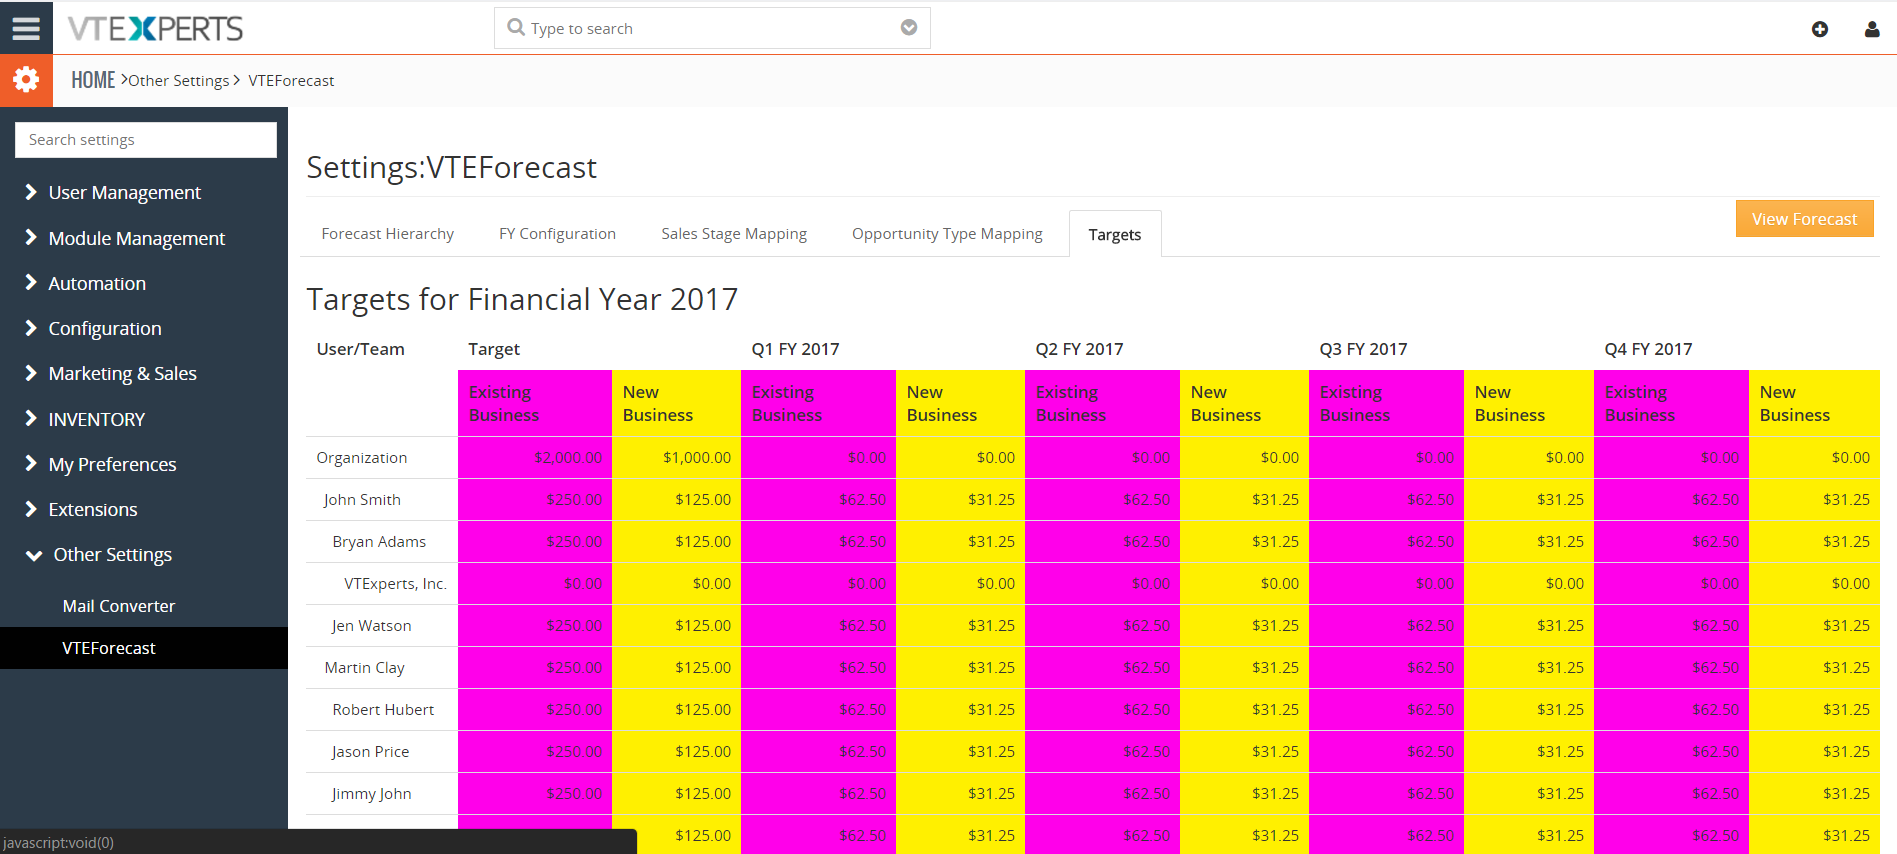
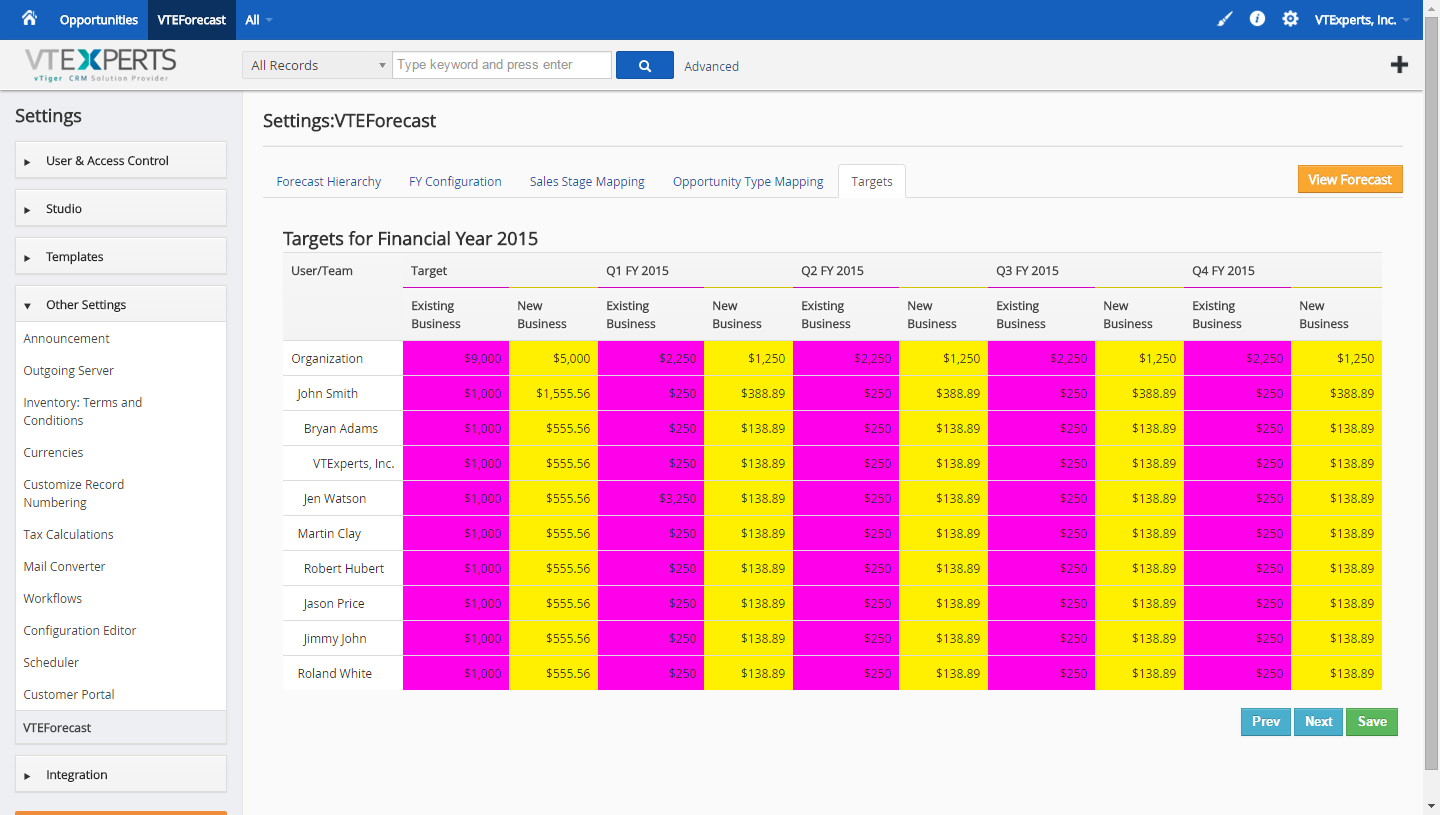
Targets
Allows you to specify target for each financial year per sales rep or team as well as the opportunity type. To change a target value, simply click on it, type the new value, and click anywhere on the screen to save.
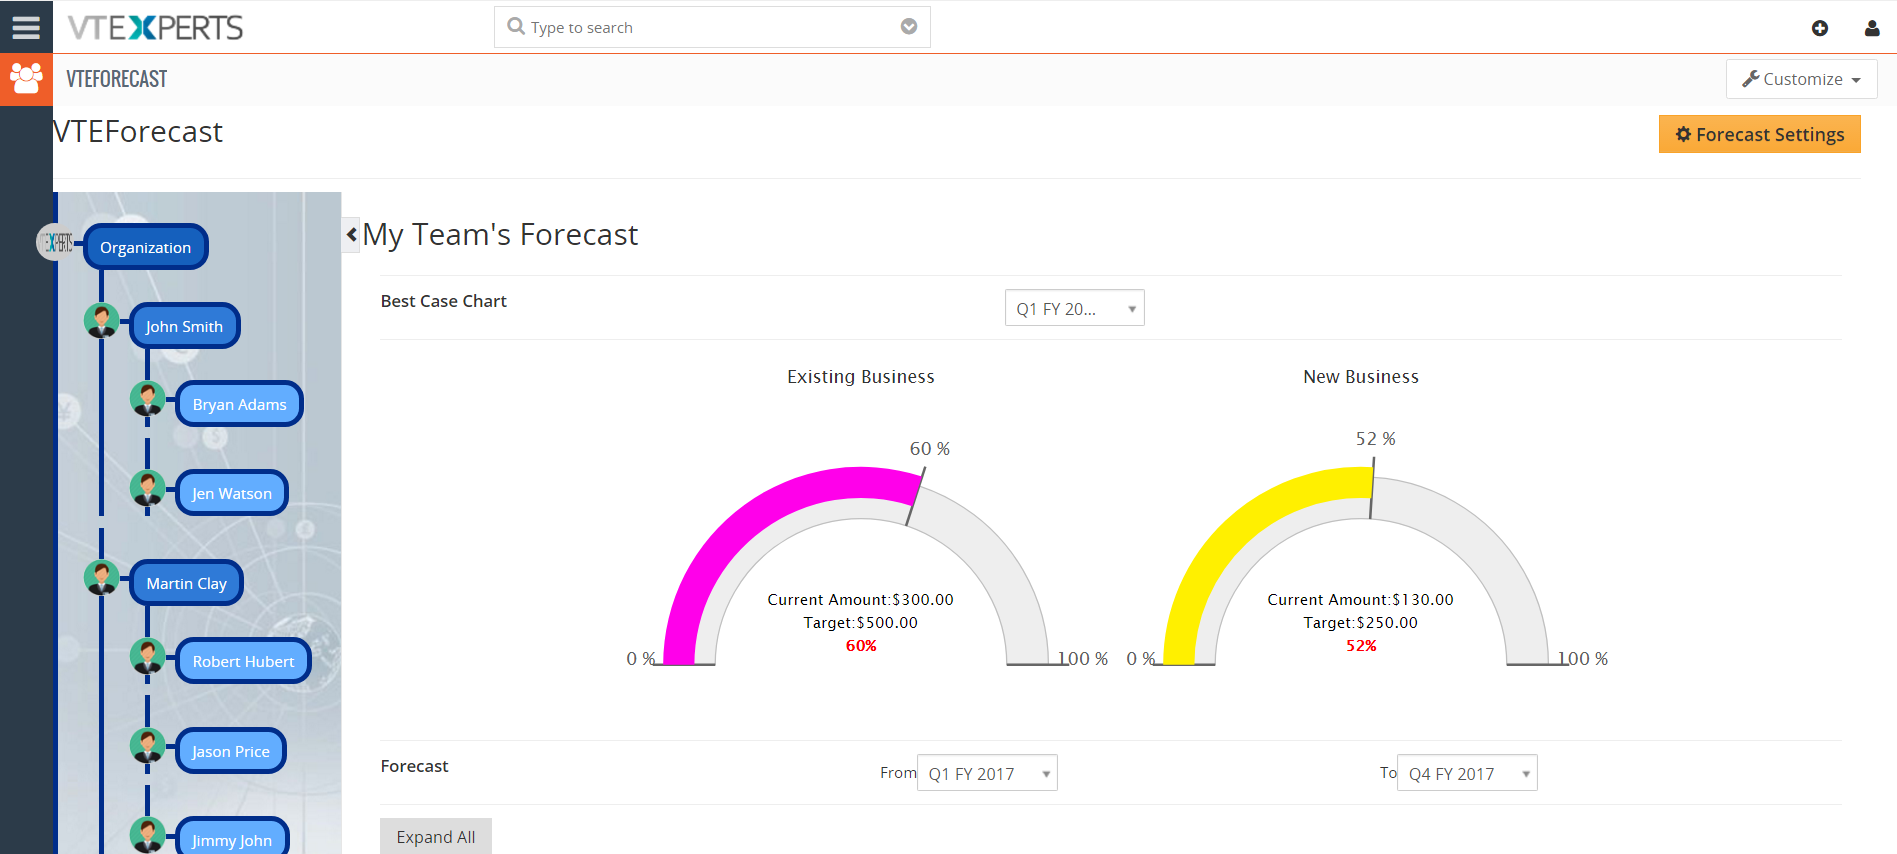
Understanding the Forecast Report
Click “View Forecast” button to open the report.
Left side bar: the list of the users and sales teams
Sort by user: to do so, click on any user and it will show the speed o meter type graph and progress of the selected user
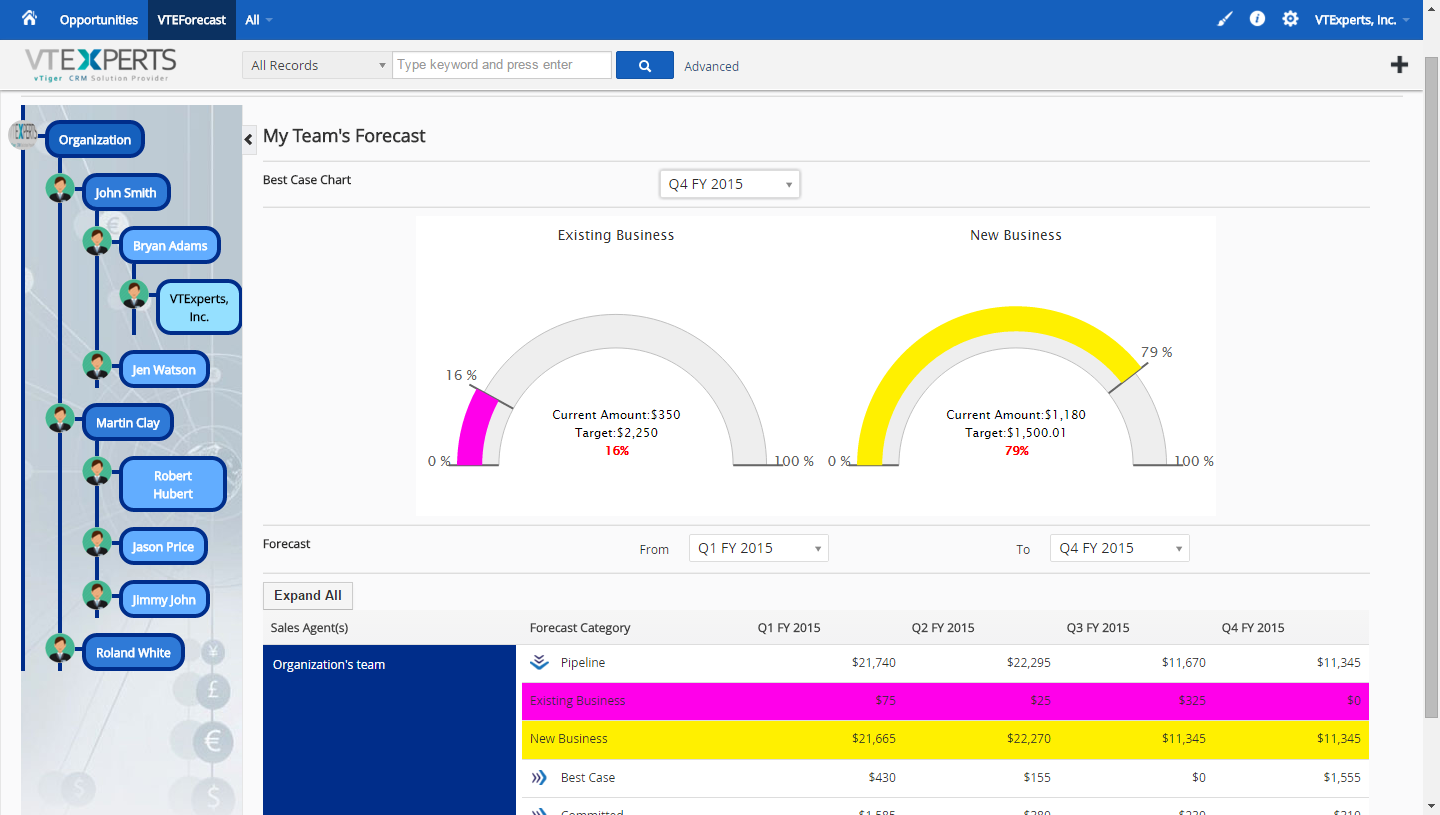
Sort by Period: the drop-down contains the months/duration that have been set up during the configuration. Selecting a period will show goals, targets, and number of sales made for each month/quarter.
Listview of Opportunities: this section is located under Best Case Chart. You can expand each sales stage and see the categories underneath. Sales teams/reps can also be expanded by click on the user’s plus icon, and every information under the user can be accessed. The list view can be sorted according to the configured periods as well.