

reports
Vtiger CRM dashboard and its uses
September 30, 2021

Article
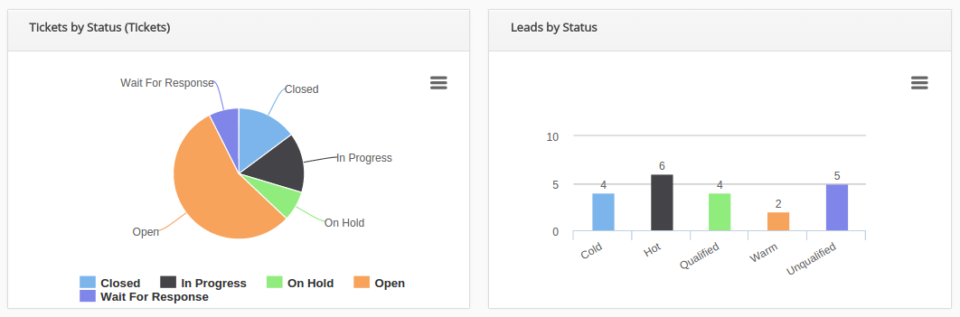
While choosing a CRM system, one of the most looked feature is dashboard. The dashboard is used to provide a quick picture of updates. For example, sales activity, support ticket responded, key performance indicators etc. Talking about the CRM dashboards, the things that comes to the mind are graphs, charts, reports etc. as they are the key components of any dashboard. What makes dashboards a good tool, is the ability to customize them extensively. This allows users to highlight only those metrics that are most used or searched most. Dashboards also allows to track the progress on different aspects of the business. Viger CRM also provides dashboard, which can be used to achieve the motives discussed earlier. In this article, we will look at Vtiger CRM dashboard and its uses. Elements of Dashboards Lets start with what elements should be included in the CRM dashboard. Following are some of the
Schedule Reports To Non VTiger Users By Adding Email Addresses In VTiger 7
May 24, 2018

Article
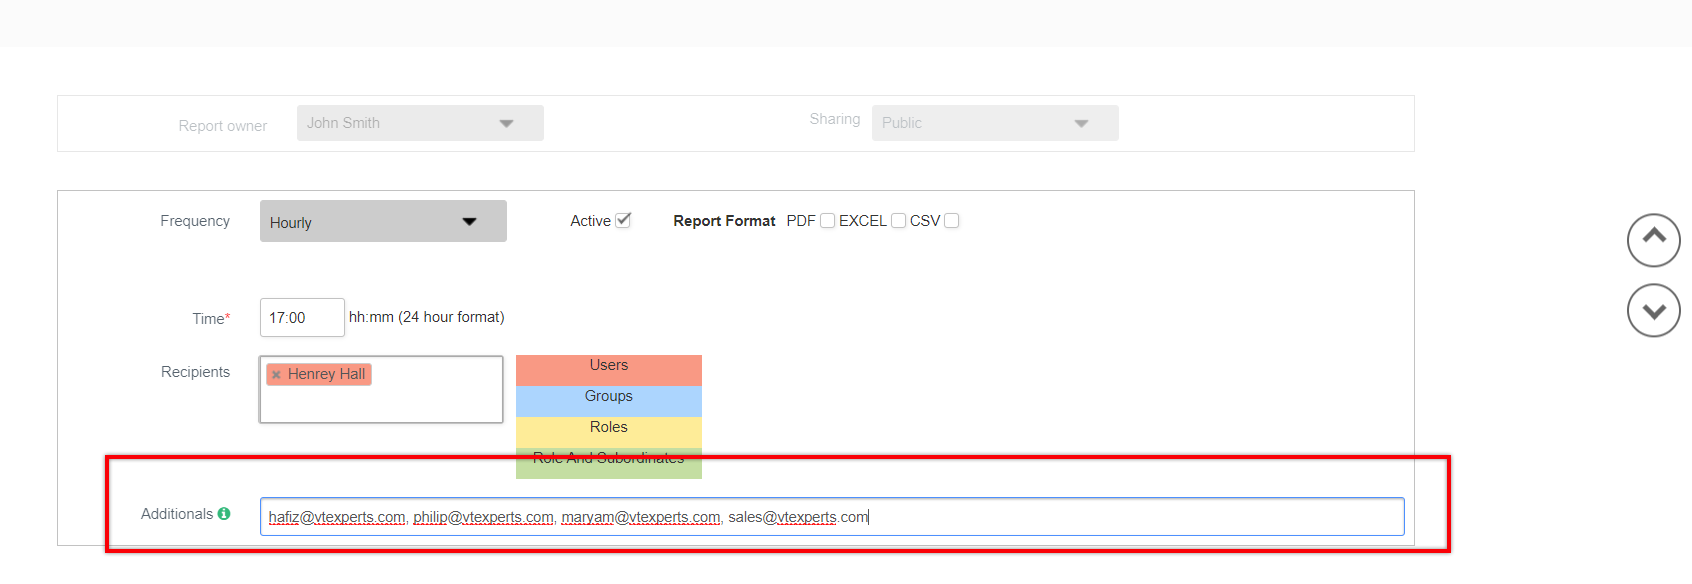
As most of you are already familiar with the Advanced Reports Extension for VTiger 6 and VTiger 7 , this is the module that more than 85% of our clients use. We make sure we are regularly upgrading our extensions to meet your requirements. Using VTE Reports extension for VTiger, you can configure and send the scheduled reports regularly to any email address, even if he/she is not a user in your VTiger CRM. How to Send Scheduled Reports to Non VTiger Users To do so, in the edit mode of a report, you need to go to scheduling section of reports. This is the one where you can configure frequency of the outgoing reports as well as time and recipients. At the bottom, you will find the “Additionals” field. In the “Additionals” field, you can add as many email addresses as you want (separated by commas). Once configured, those
Run Pivot/Matrix Reports In VTiger 7
April 17, 2018
Article
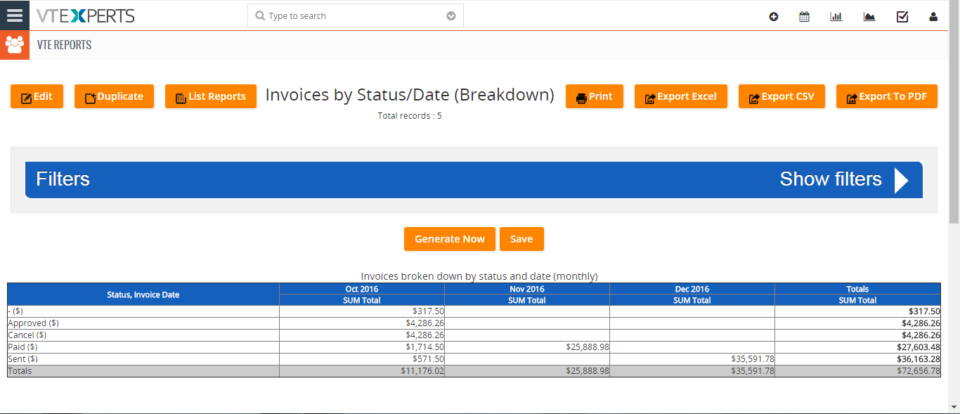
Professional Reports is a tool built to fulfill the needs of all the businesses looking to run complicated, but easy to read reports. It includes a report builder which is capable of creating detailed, summary, pivot, chart reports. All the charts and reports can be placed on the dashboard for quick & easy access. How to Run Pivot/Matrix Reports Go to the Menu >> VTE Reports and click on the “Add Report” button. Enter the Name, Description, Module and the Folder Here we can Sum, Average, Min and Max values when working with invoices. For this example we only use Total. Here you can change the label of the Total. Here we have the ability to create Rows and Columns for Matrix Reports. Here we can filter our Reports Status. Configure Report sharing(For this example we use Public). Then we can use Frequency for schedule Reports. Here we
VTIGER 7’S SALES REPORTING EMPOWERS CUSTOMER DEVELOPMENT AND SATISFACTION
March 21, 2016
Article
Sales managers impact the performance of an organization hugely. They can do so either by setting the quarterly sales targets, establishing a regional price, or setting revenue goals etc. Vtiger 7 has a whole new set of features Sales Report that generates pictorial representations of the historical data, which provide the key insights and profit yielding results. Vtiger 7’s custom report feature allows to obtain insights about sales process If your plans are to analyze how the key operations of the business are being performed, Vtiger7’s customizable reports, charts, and figures are the right tools for you. Regional sales can be managed separately with Pivot Reports. Bar and Pi charts aid in identifying the high performing sales reps as well as highlighting those who need assistance. The pictorial representation of data can contribute significantly to make profitable decisions and Vtiger 7 provides you with the best solutions in this